
Hello I'm
Tanmoy Banerjee
— Data Analyst / Sr. PowerBI Developer


Certified Data Analyst / Sr. Power BI Developer with close to 10 years of experience and 7 years of experience in Analytics & Data Visualisation Field, enthusiastic and eager to contribute to team success through hard work, attention to detail and excellent
organizational skills. Clear understanding of tasks and training in skill. Motivated to learn, grow and excel in IT-industry.
Organized and dependable candidate successful at managing multiple priorities with a positive attitude. Willingness to take on
added responsibilities to meet team goals.
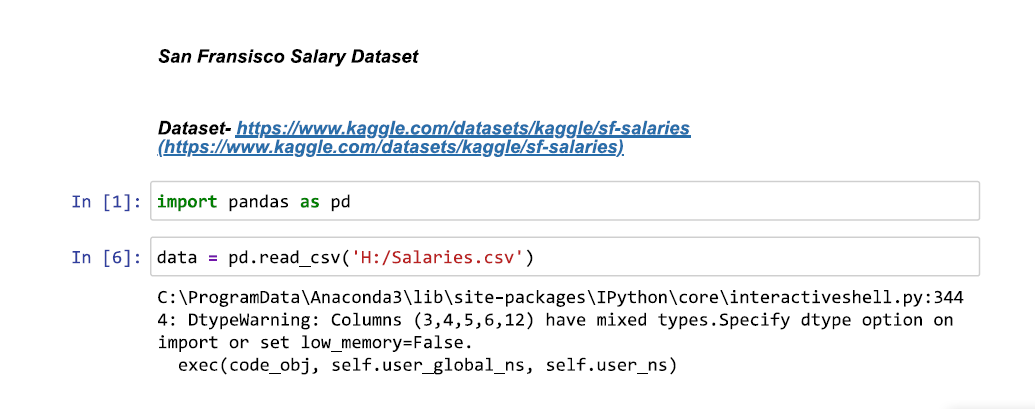
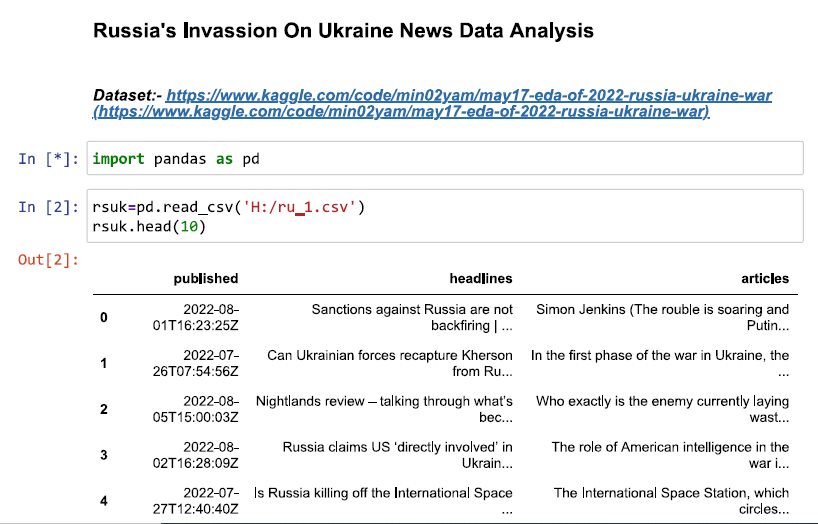
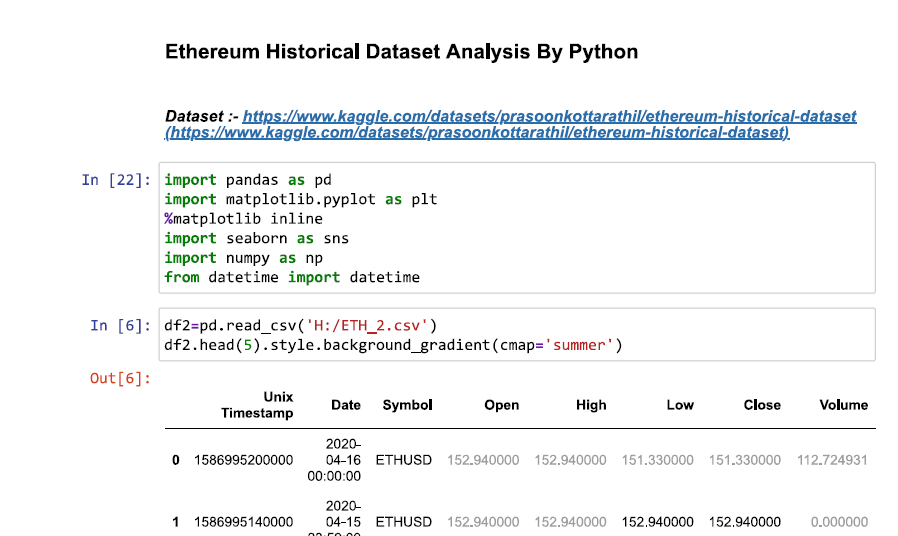
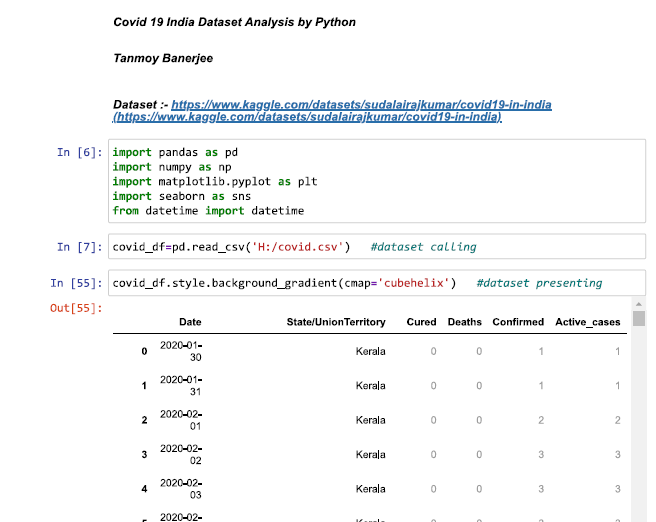
Excellent in --- Power Bi, Dax,Tableau, Data Visualization, Dashboard Building, MySQL, Advanced Excel, Statistics, Google Sheets, Business Analysis, Python with Pandas, Matplotlib,Seaborn,Data Analytics, Data Mining, Presentation Skills and PowerPoint.
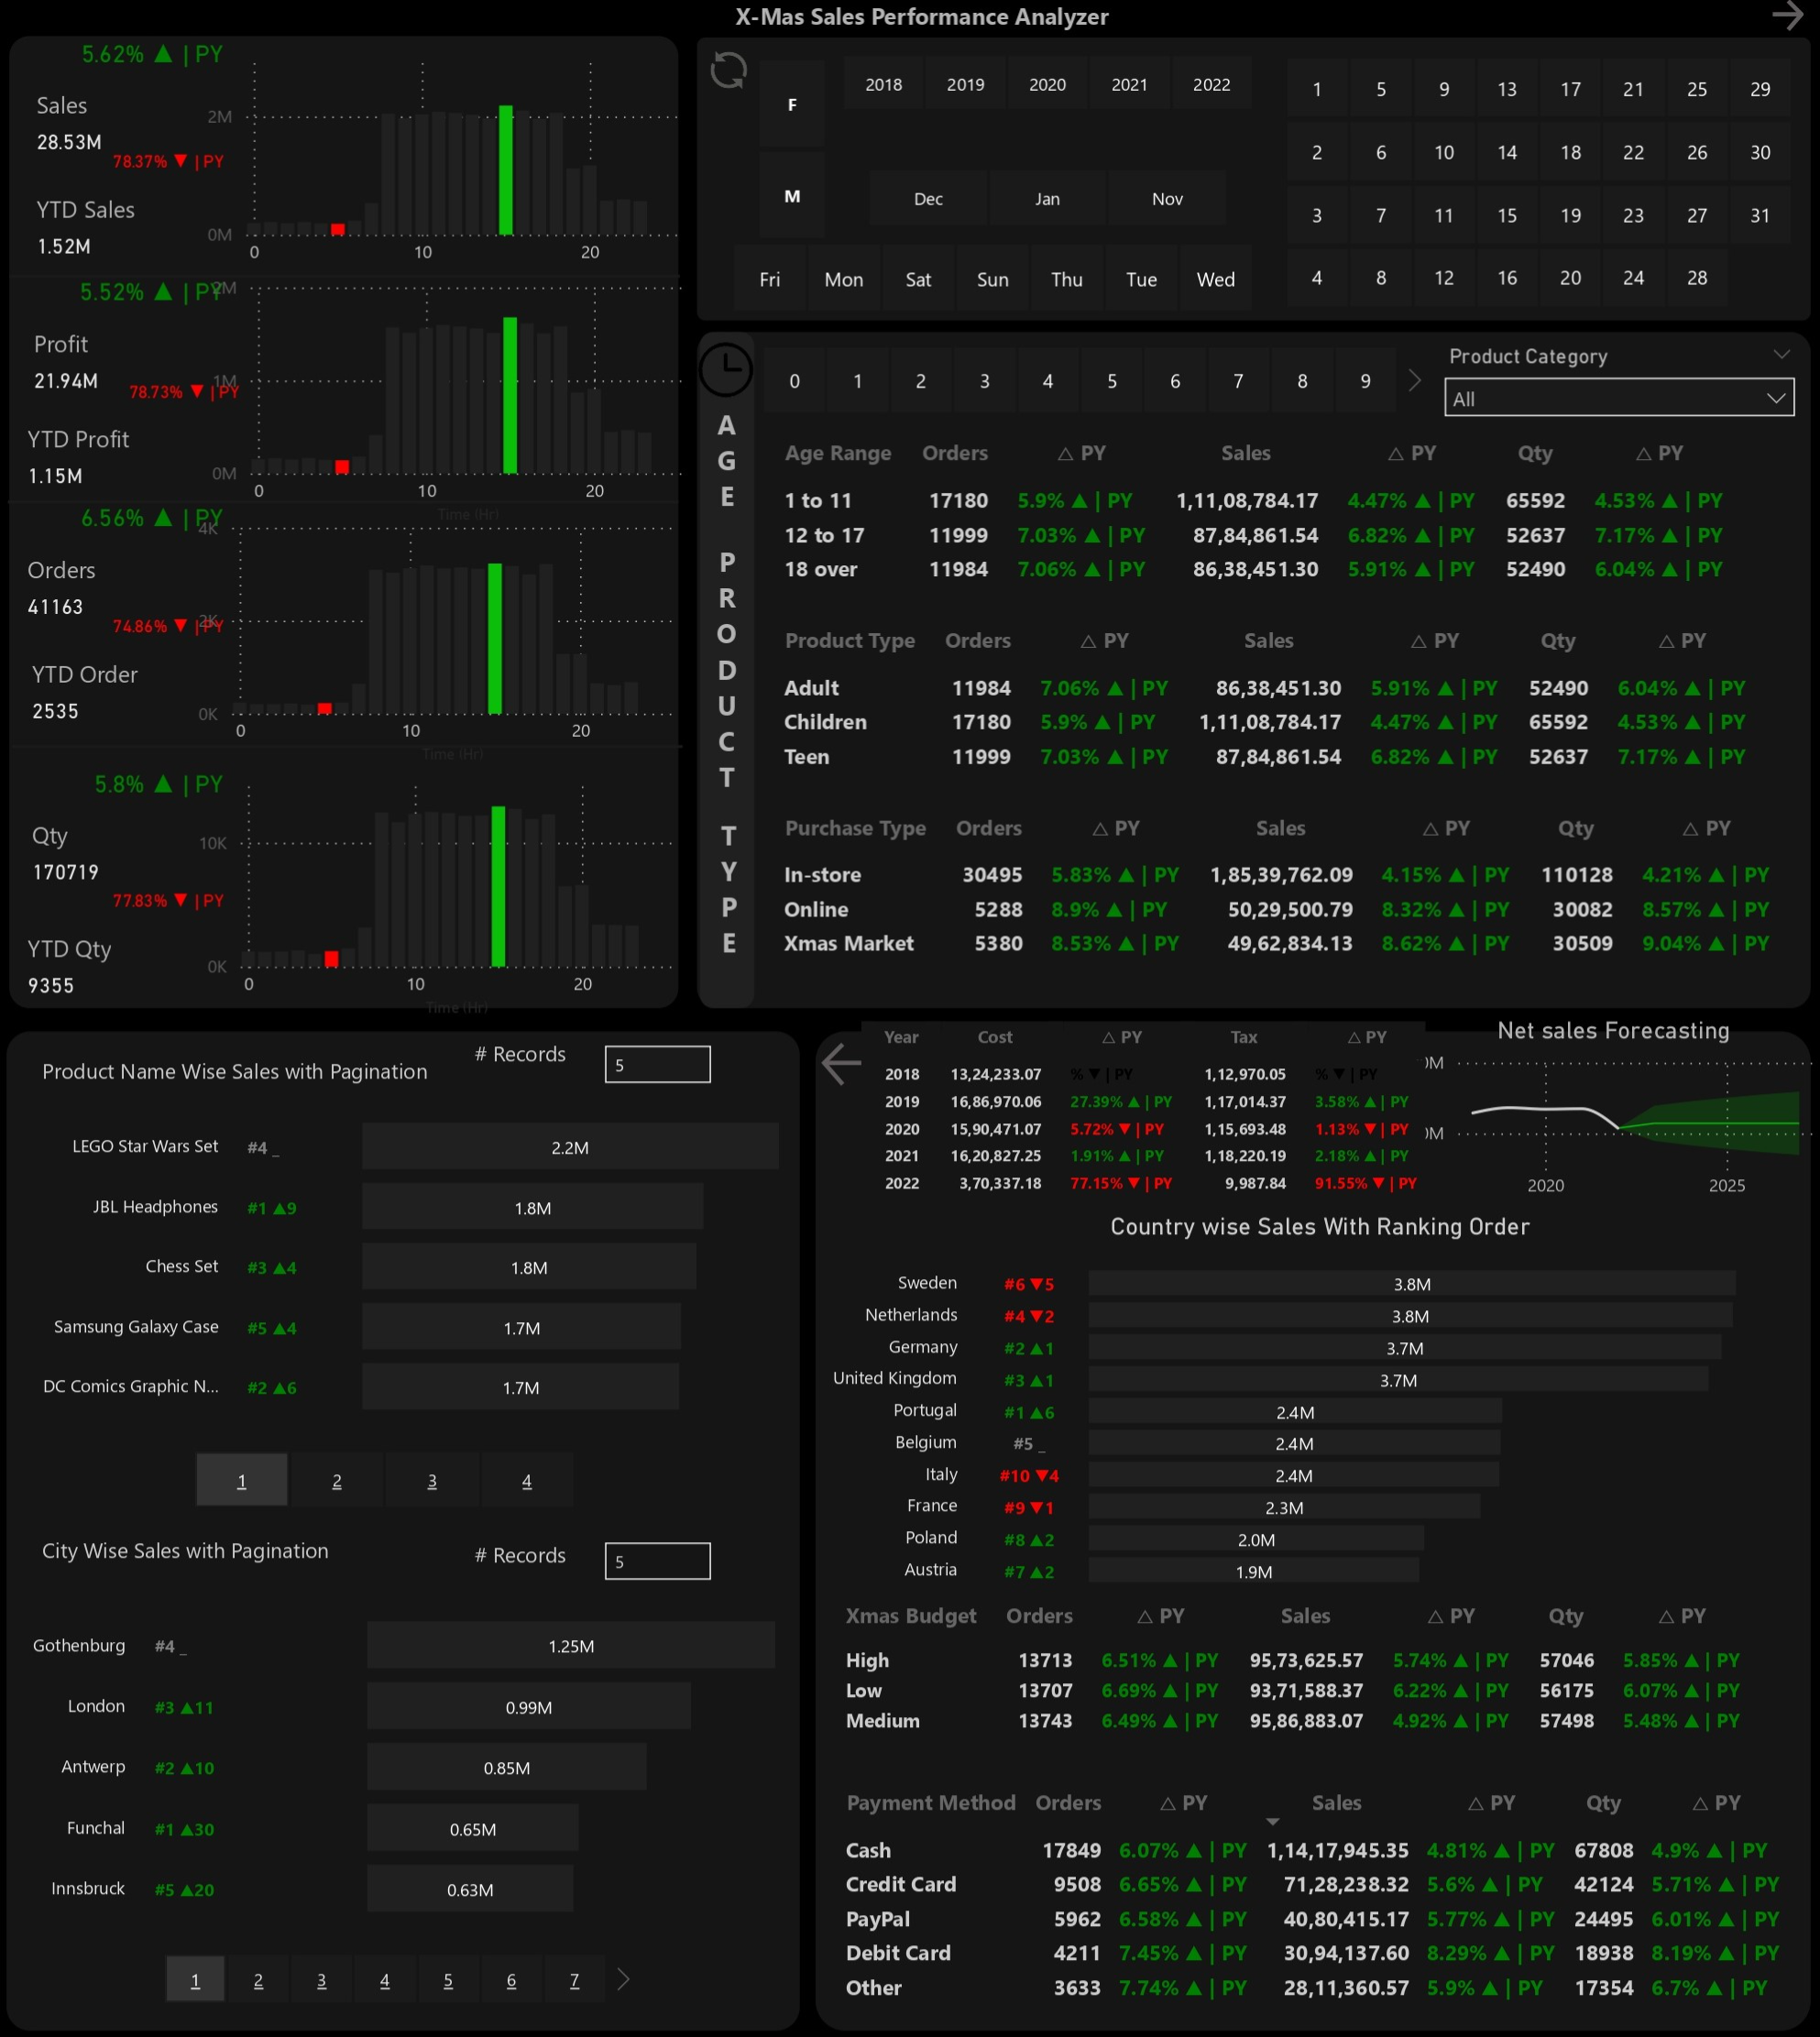
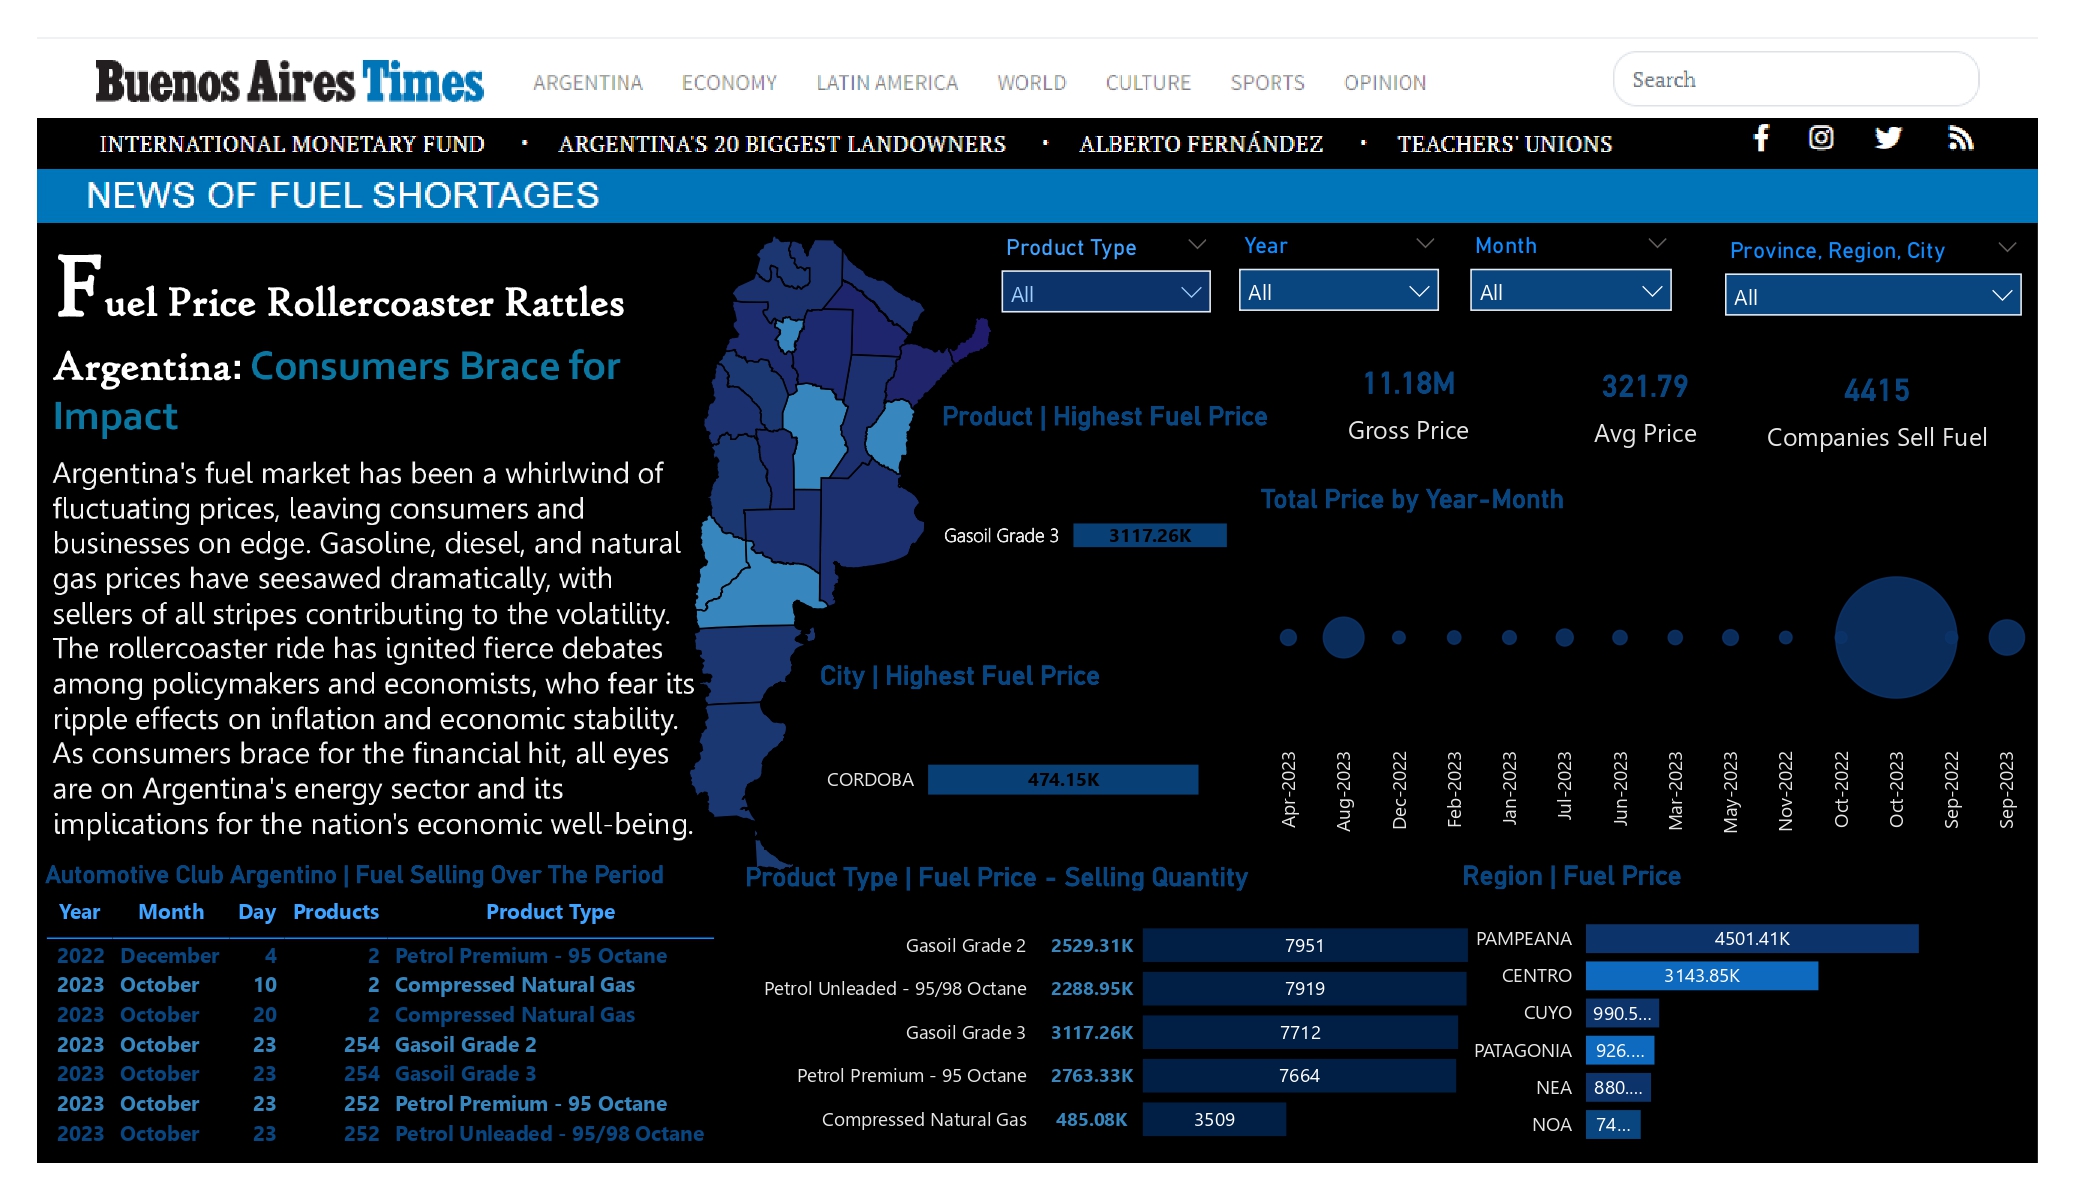
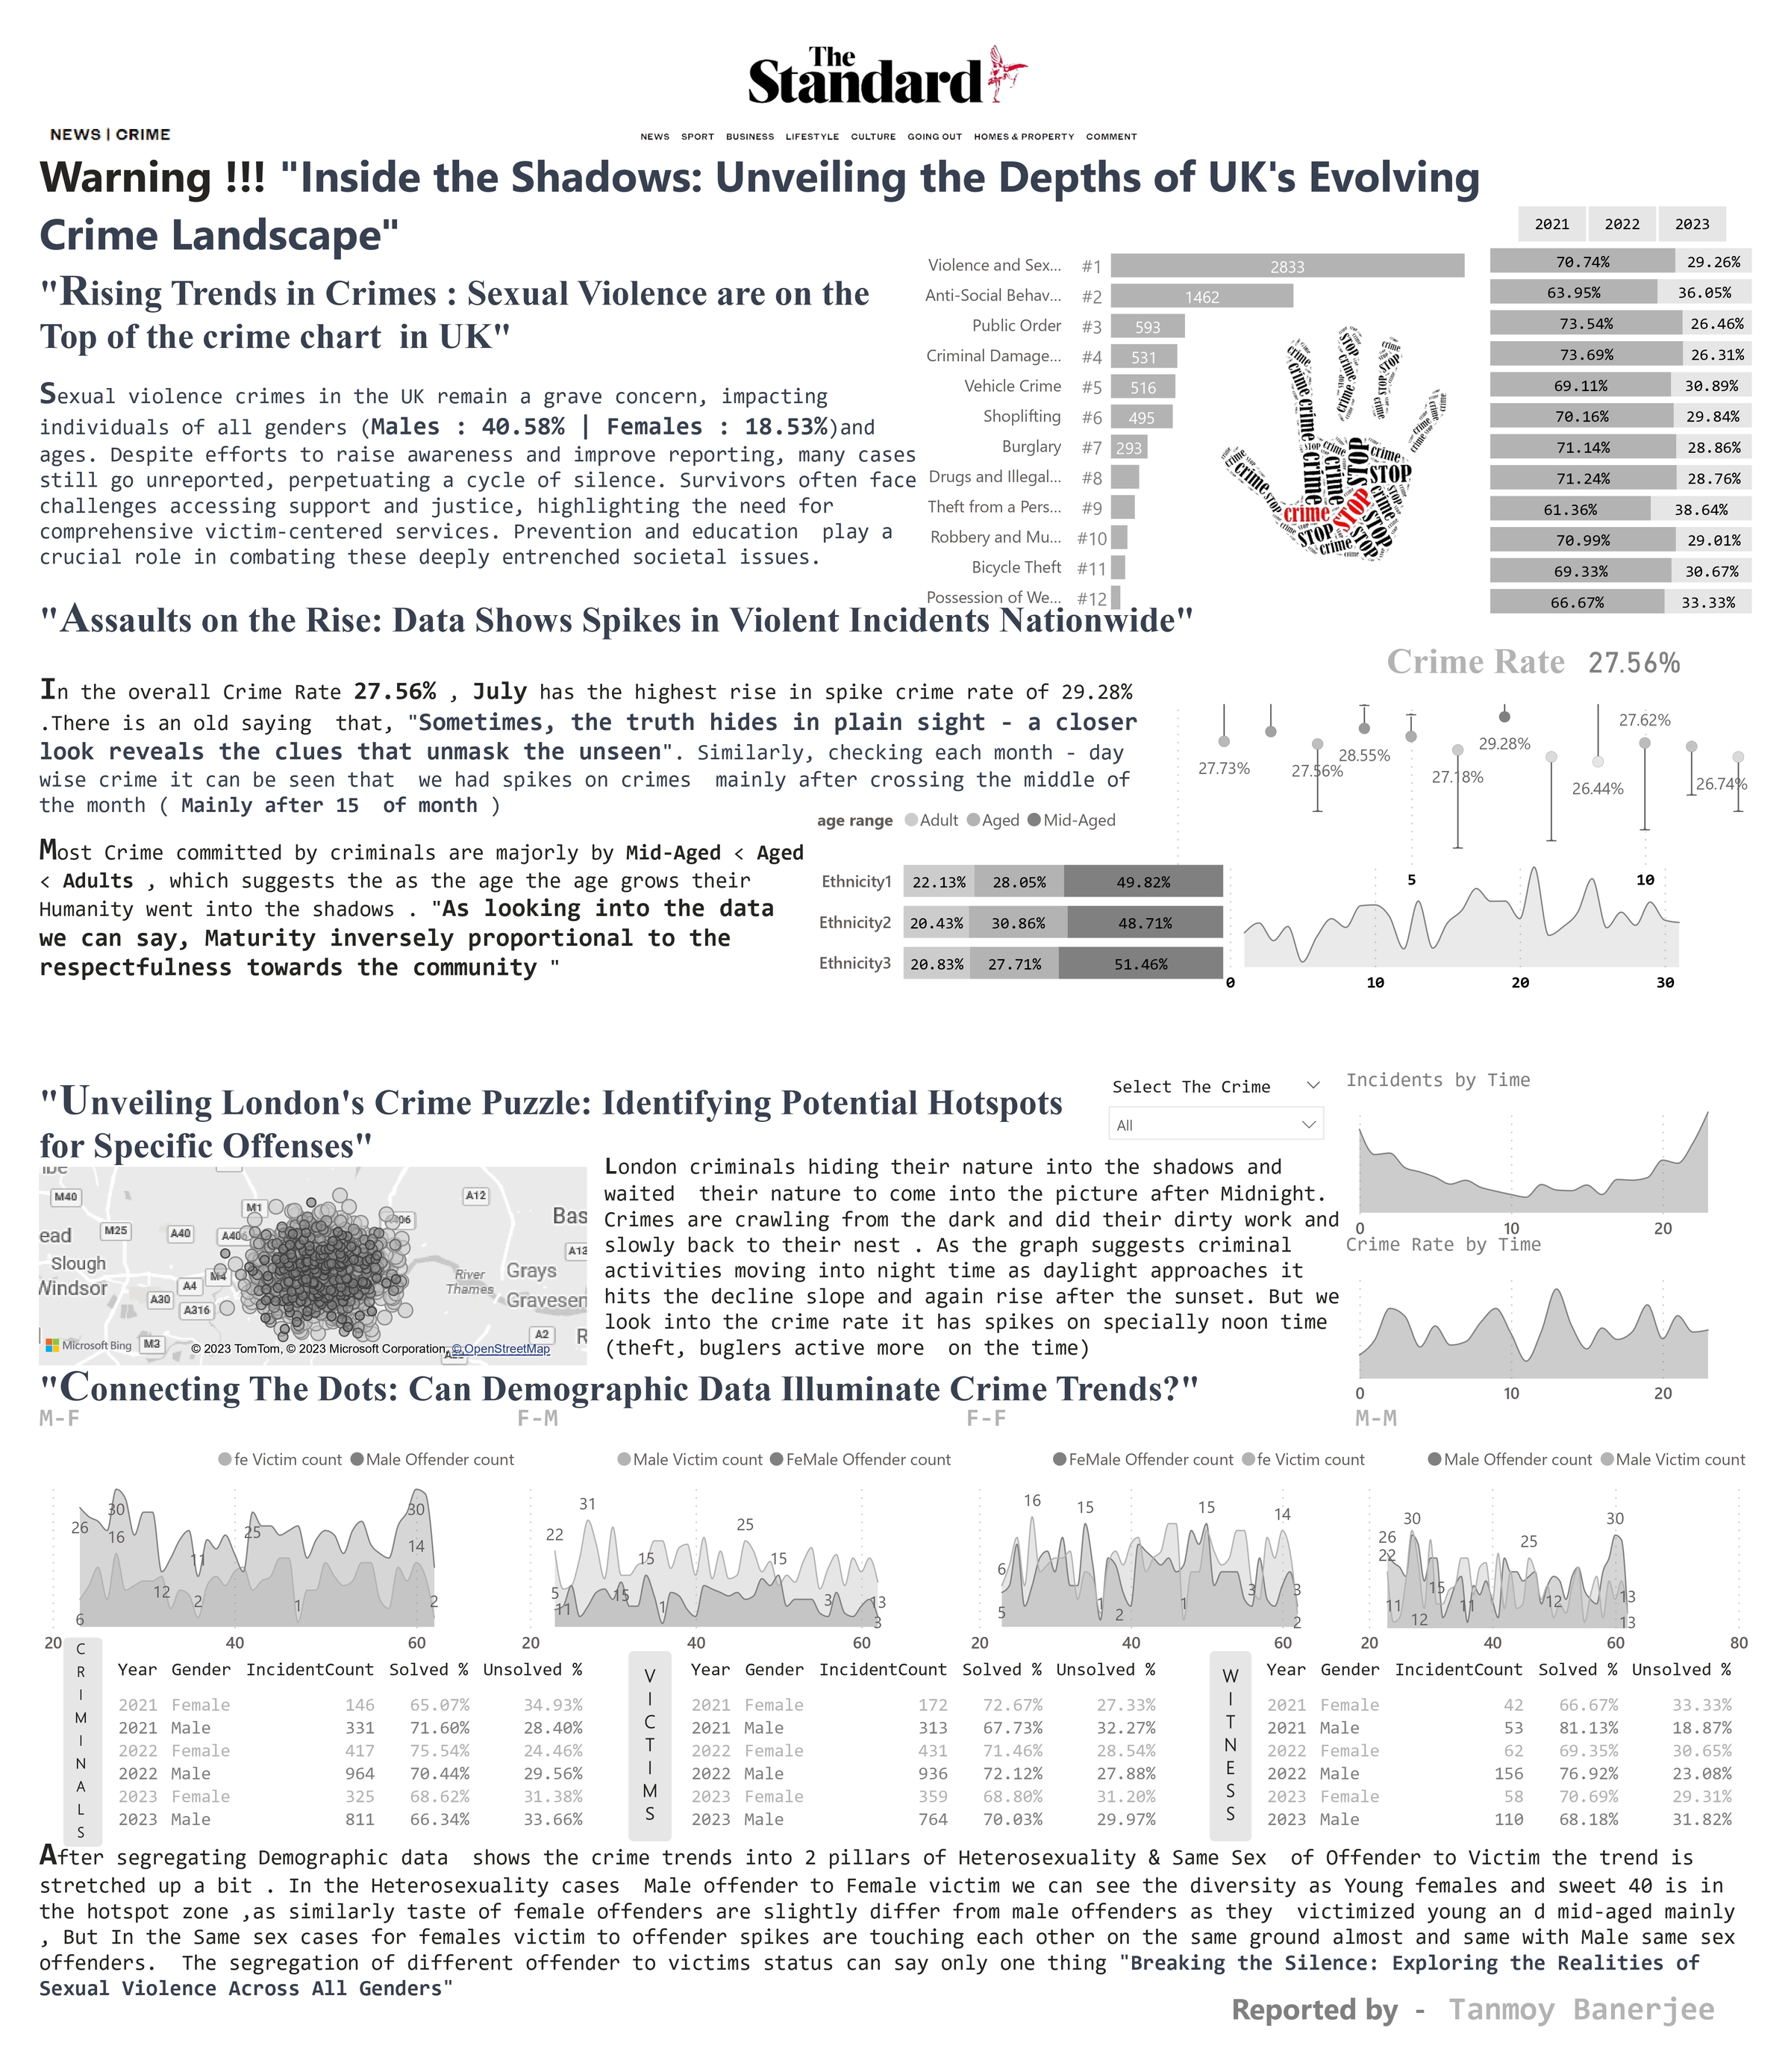
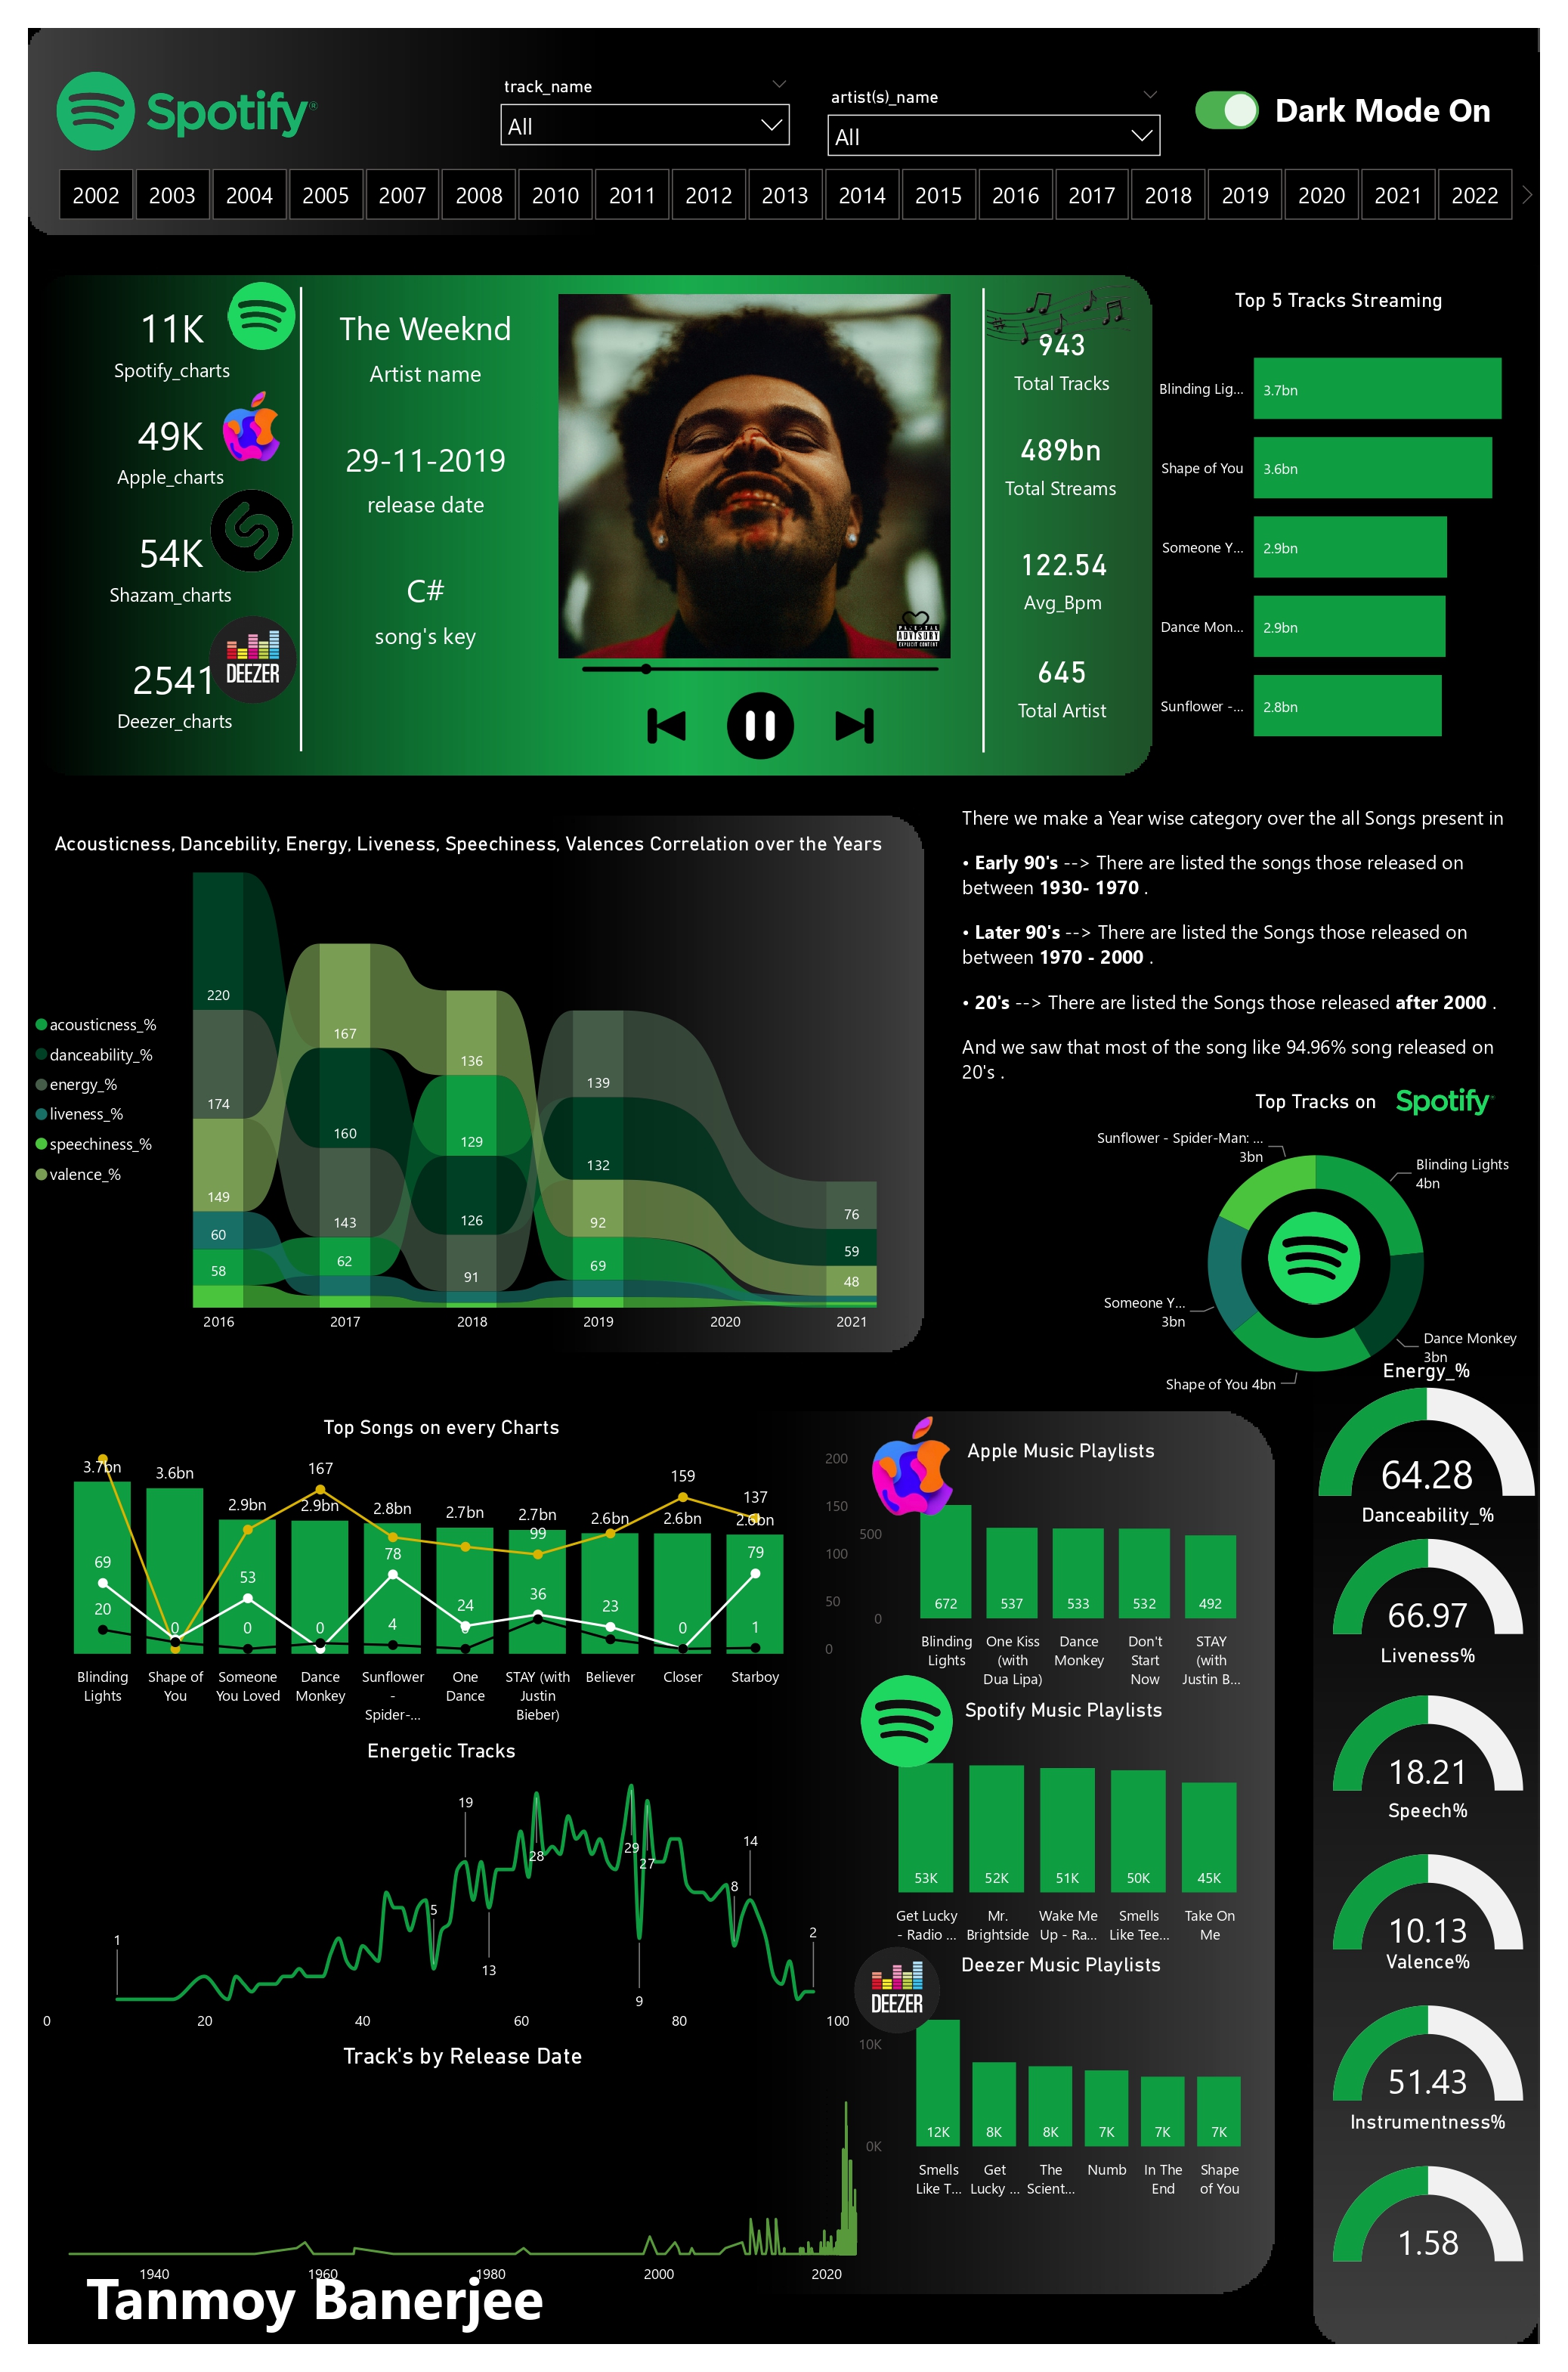
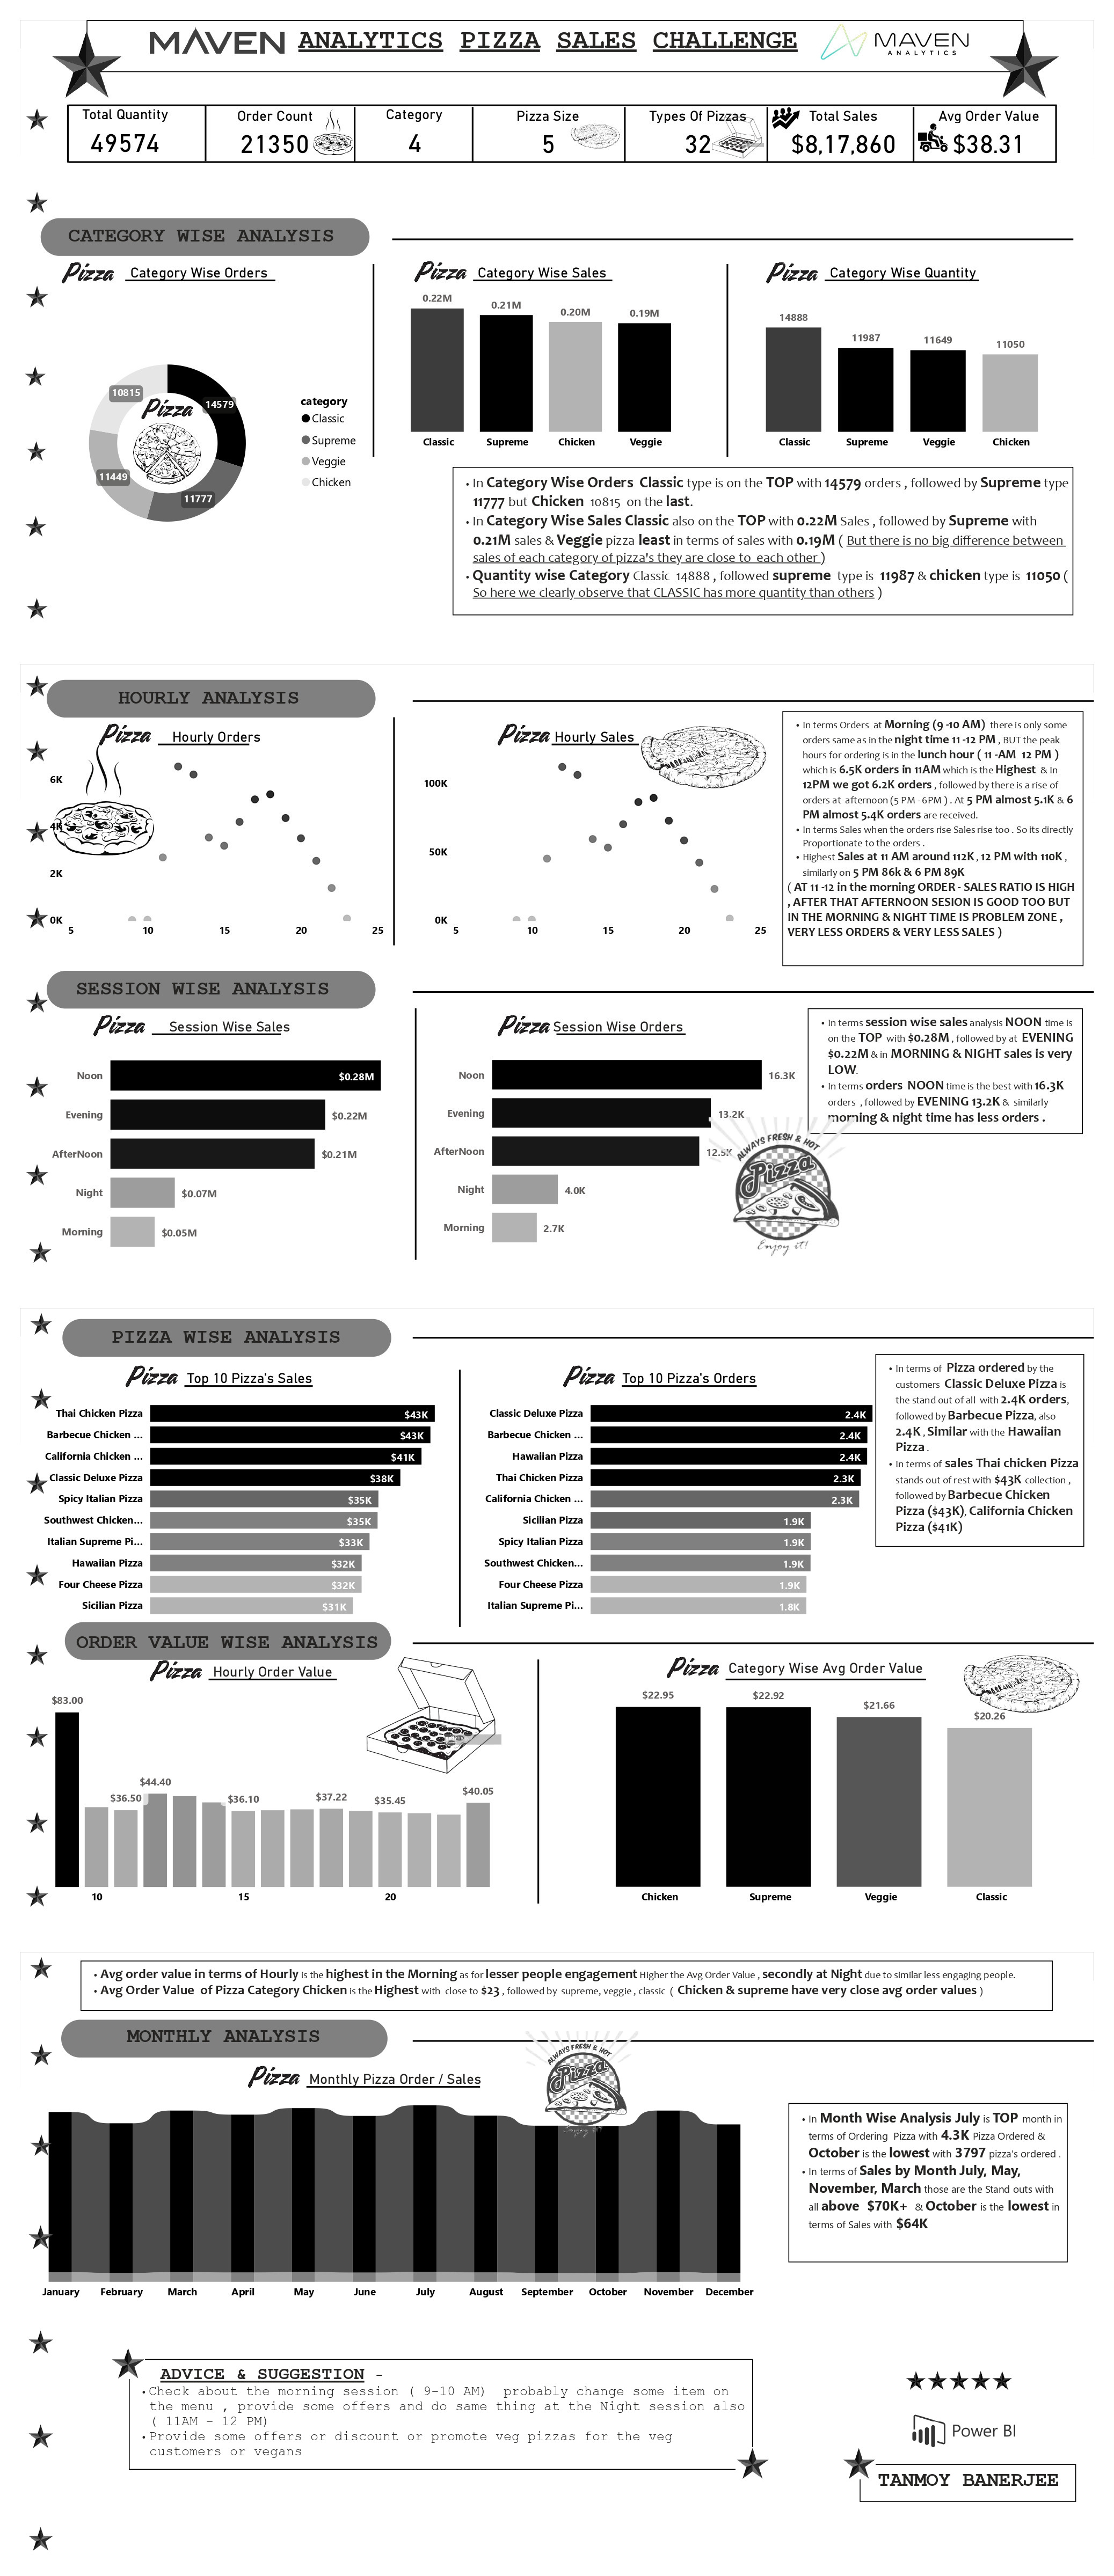
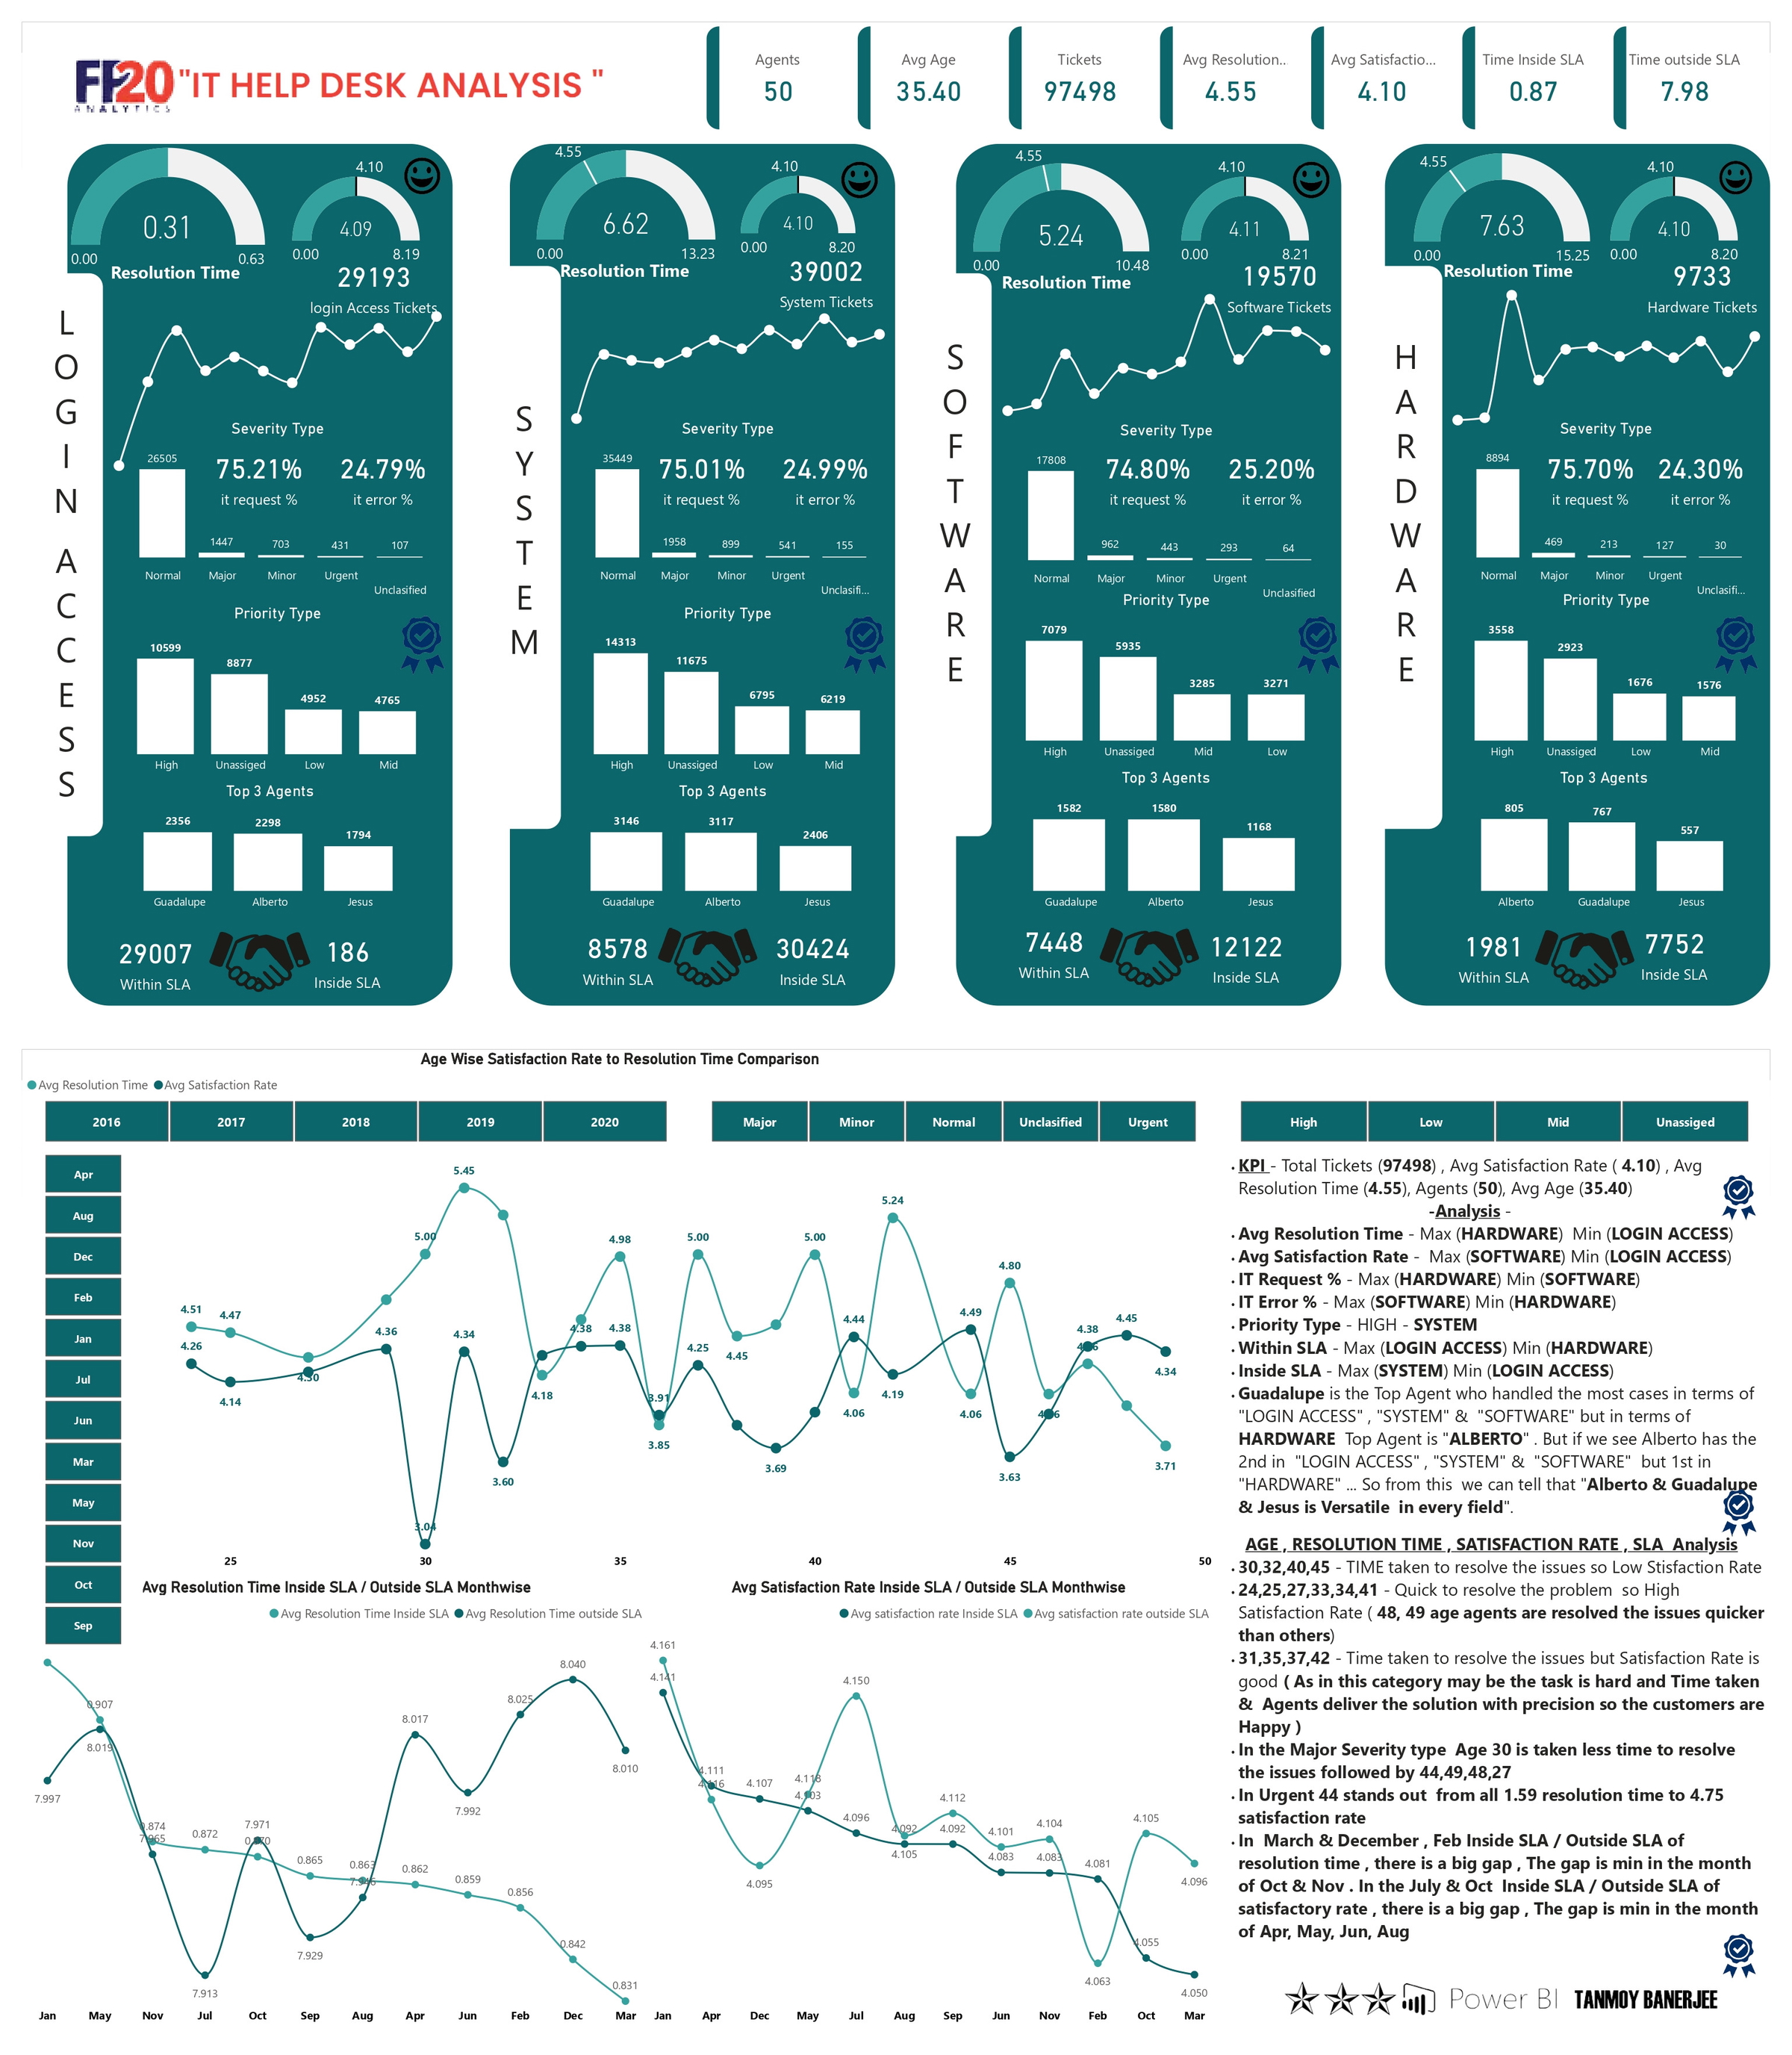
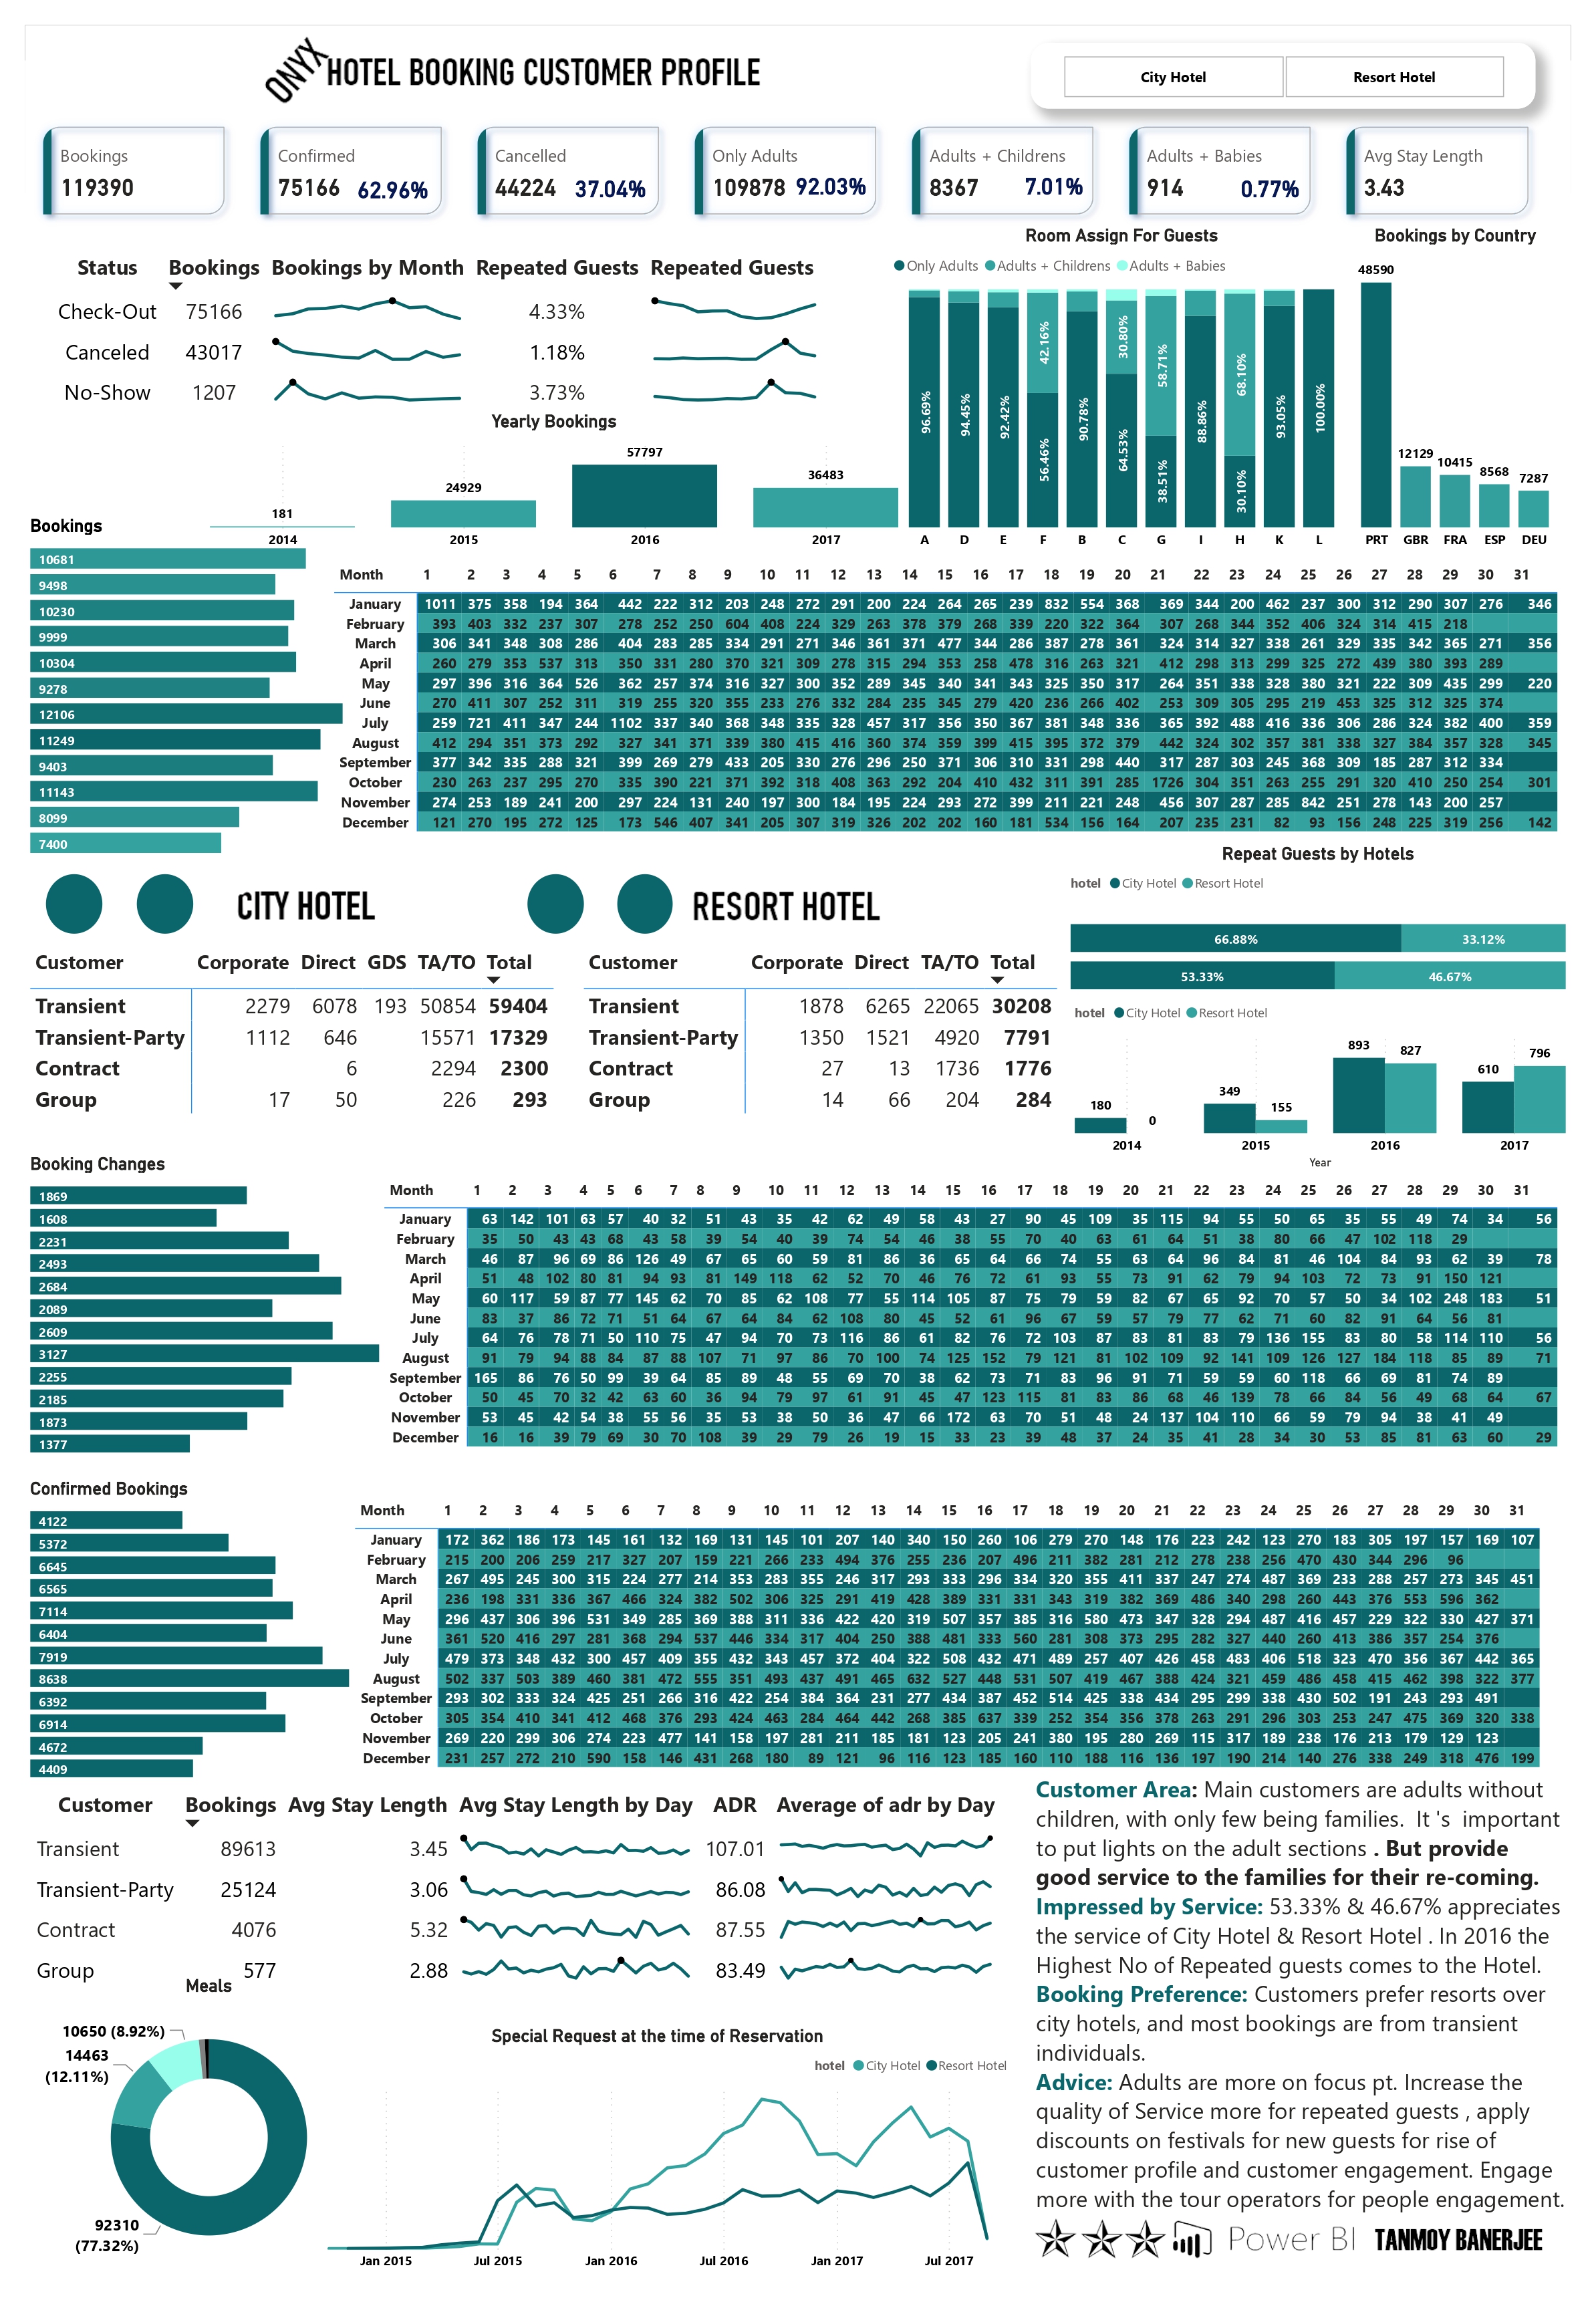
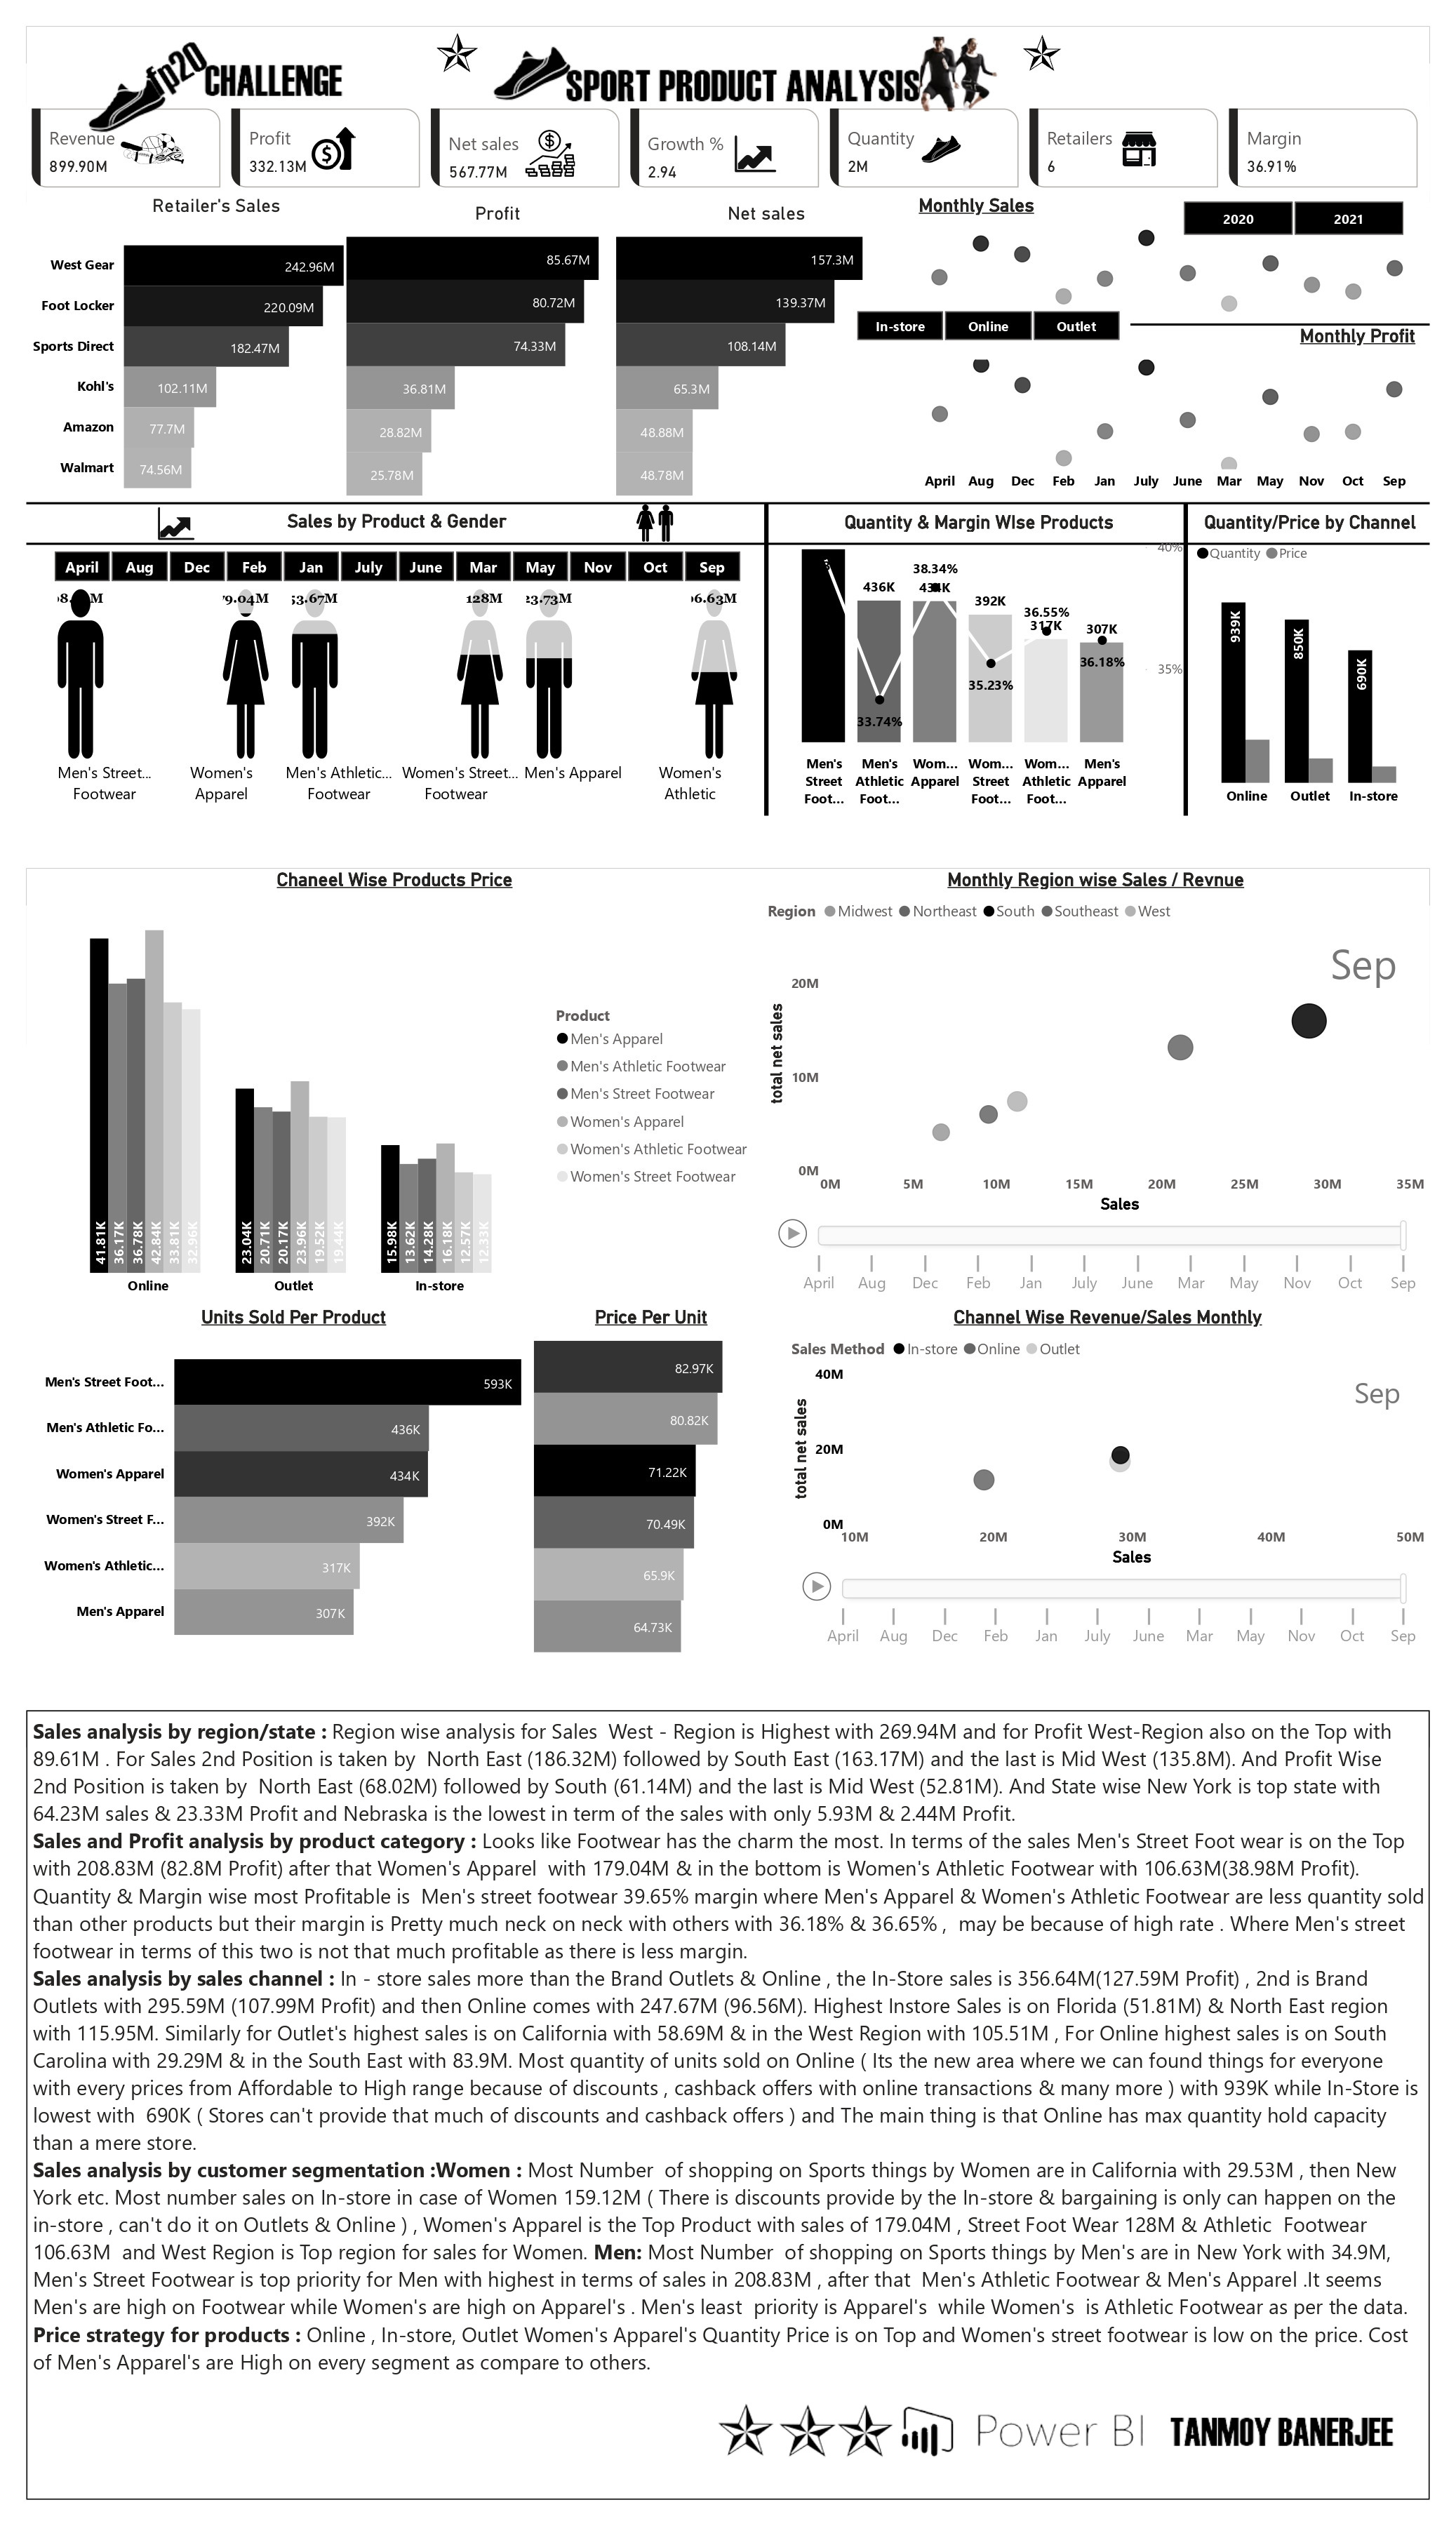
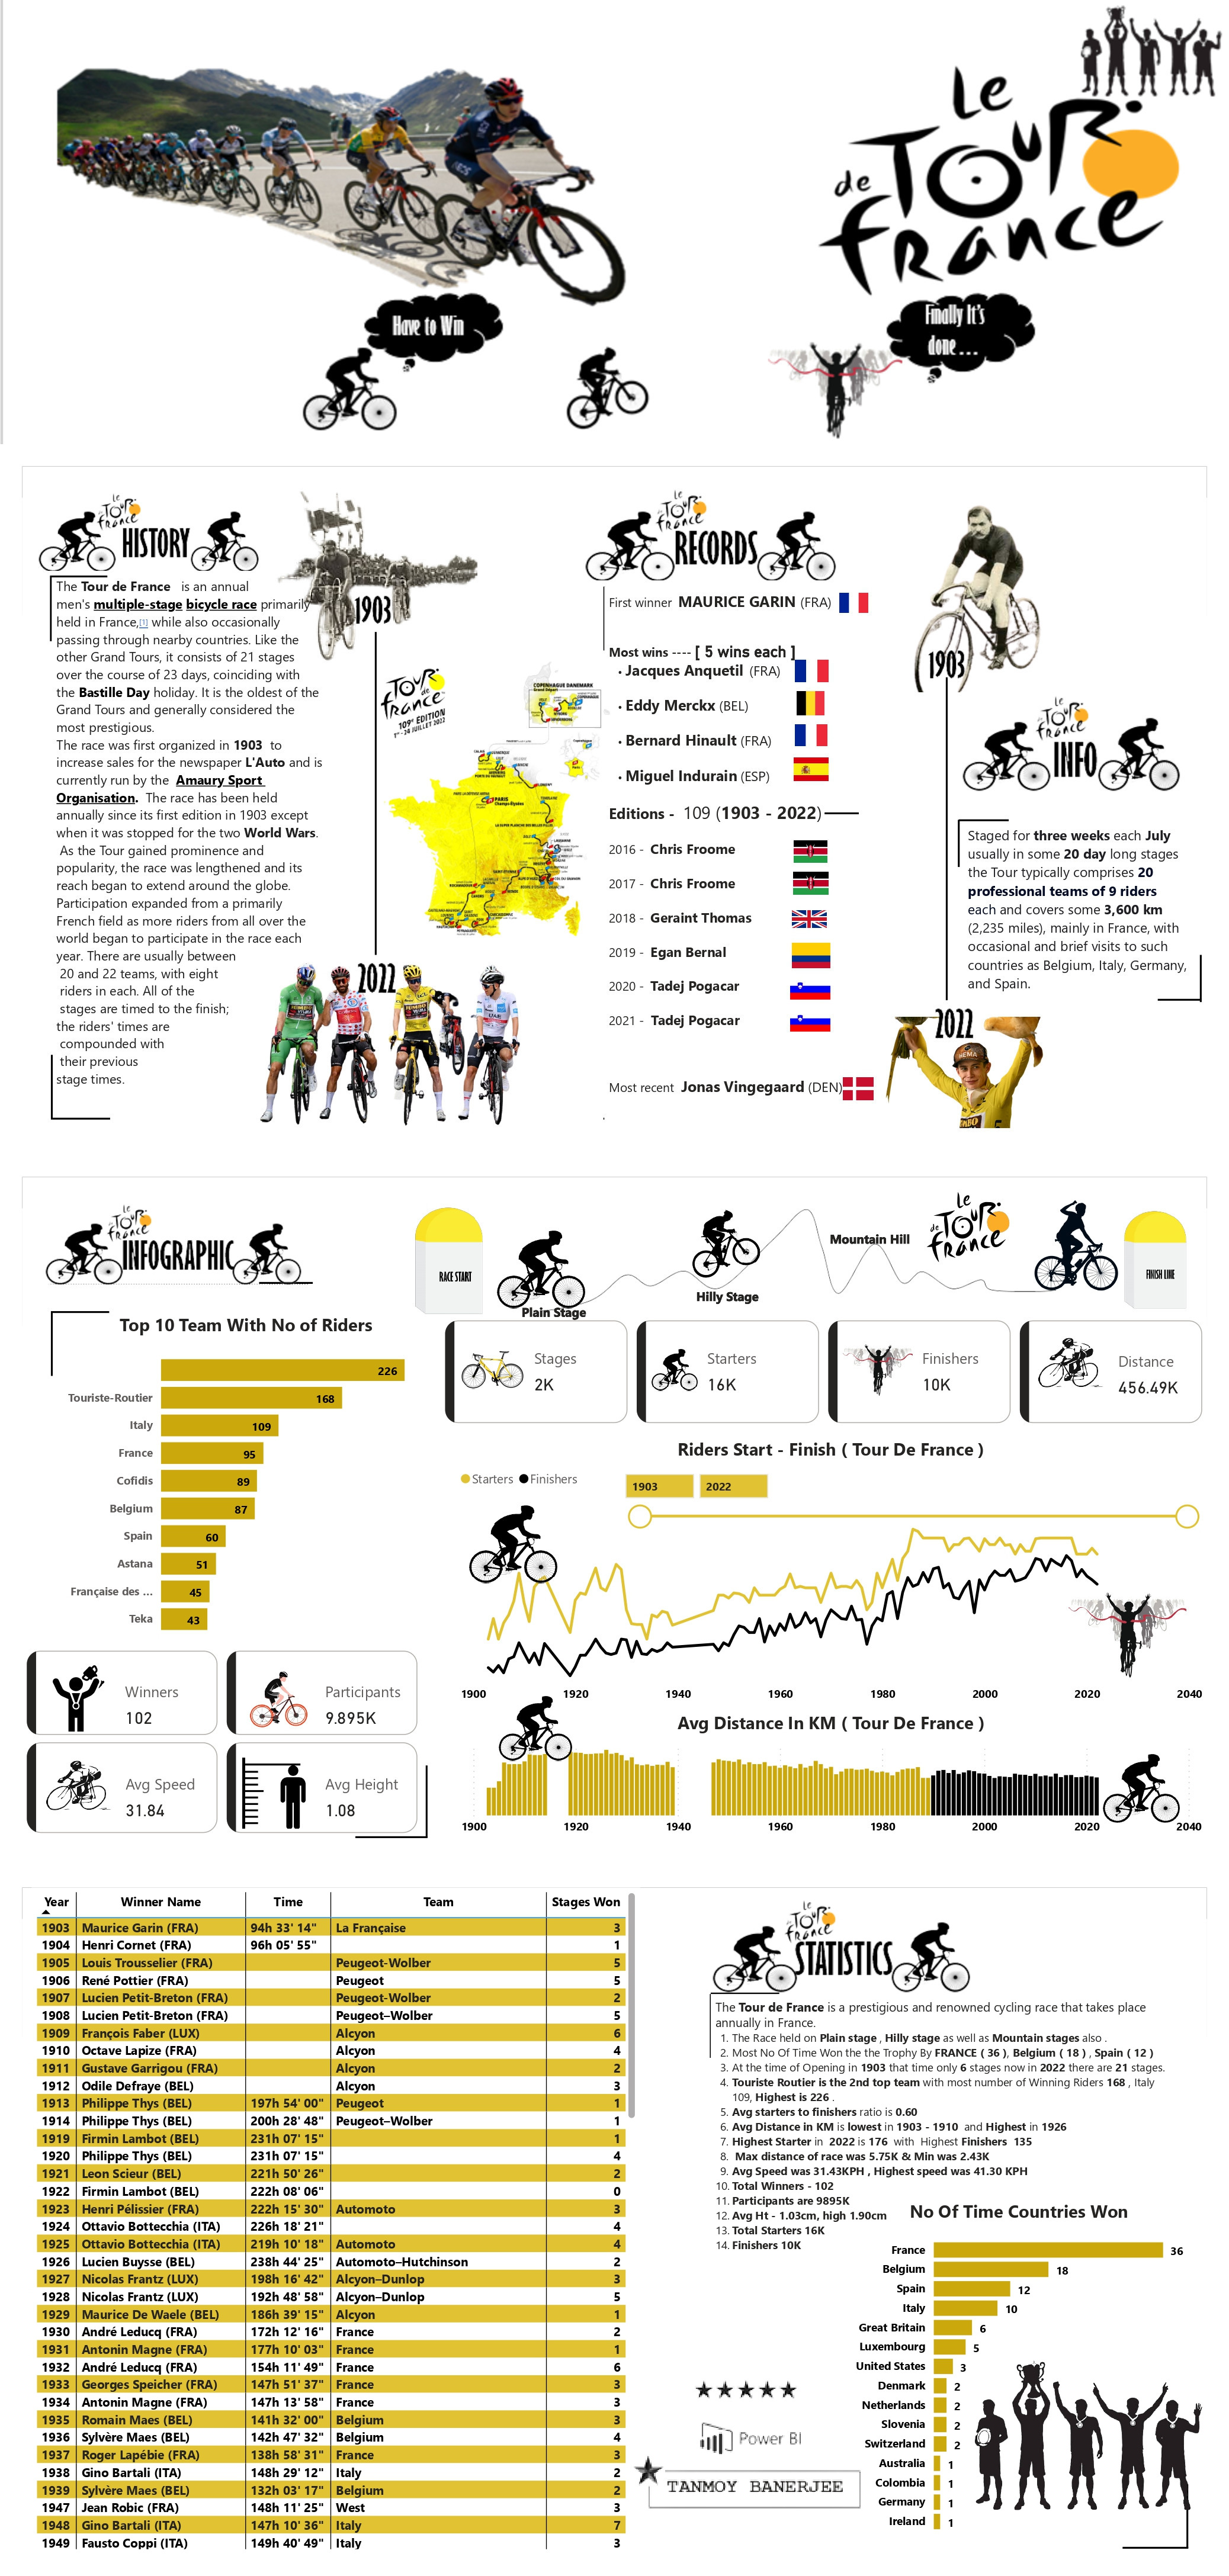
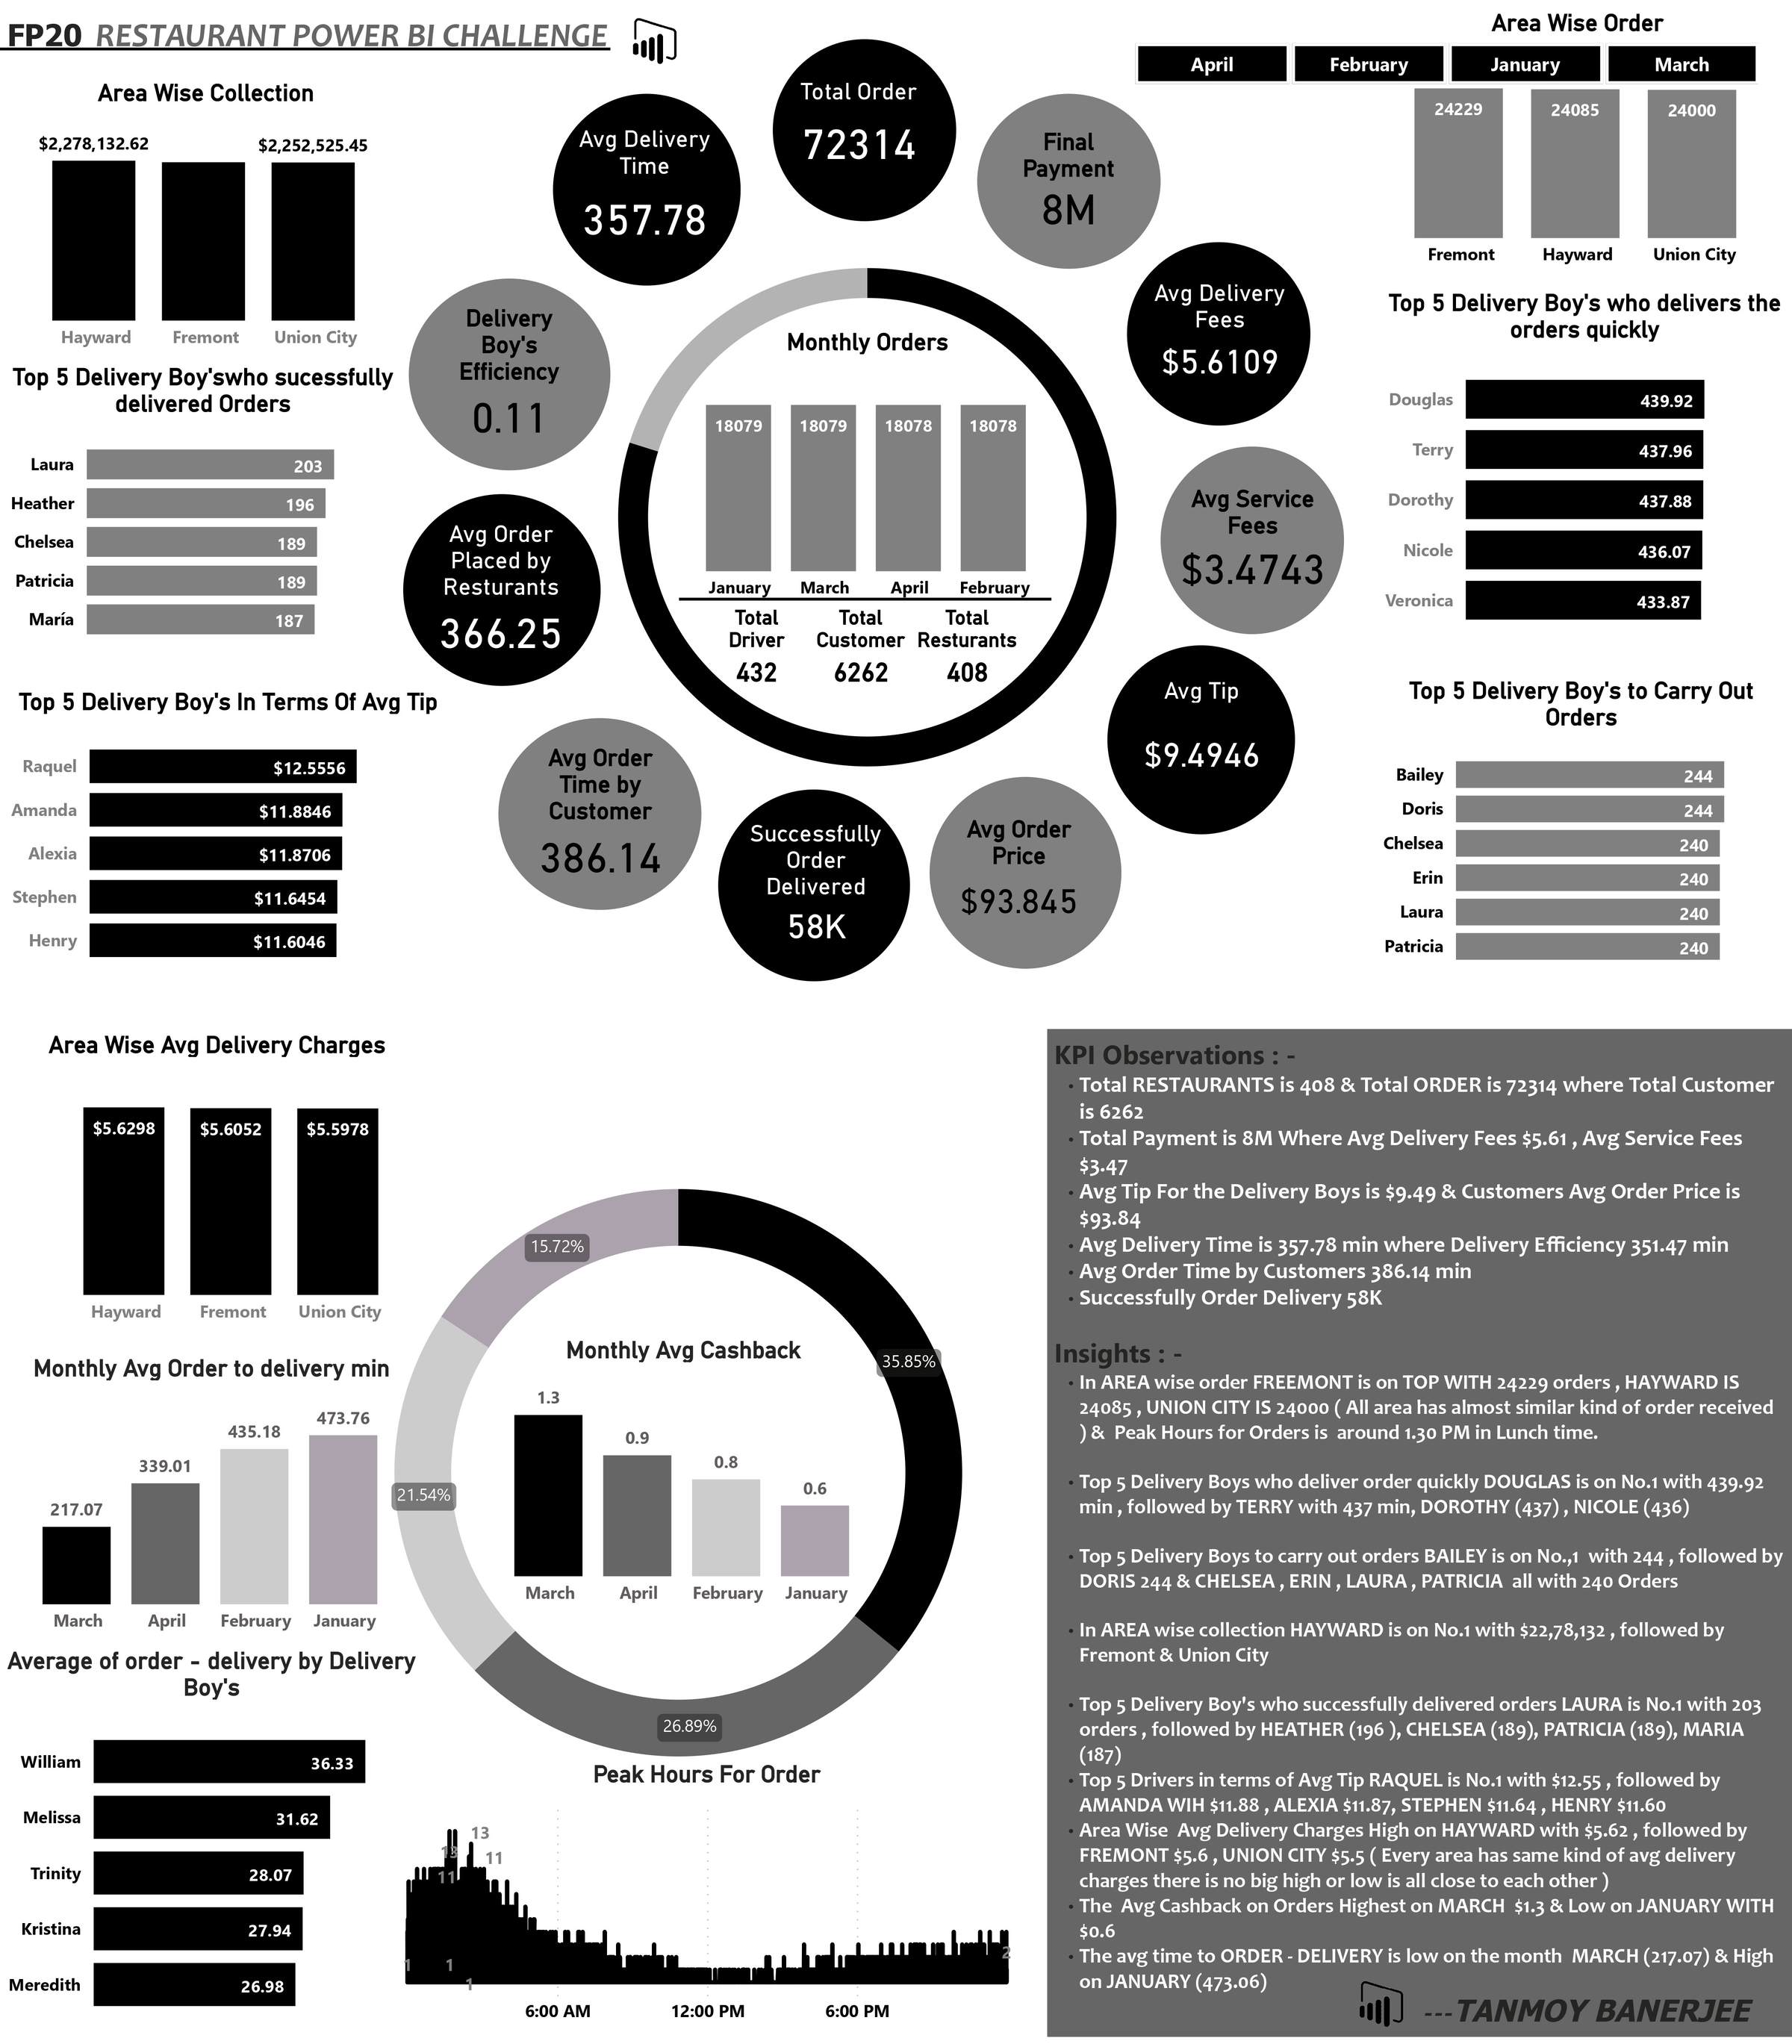
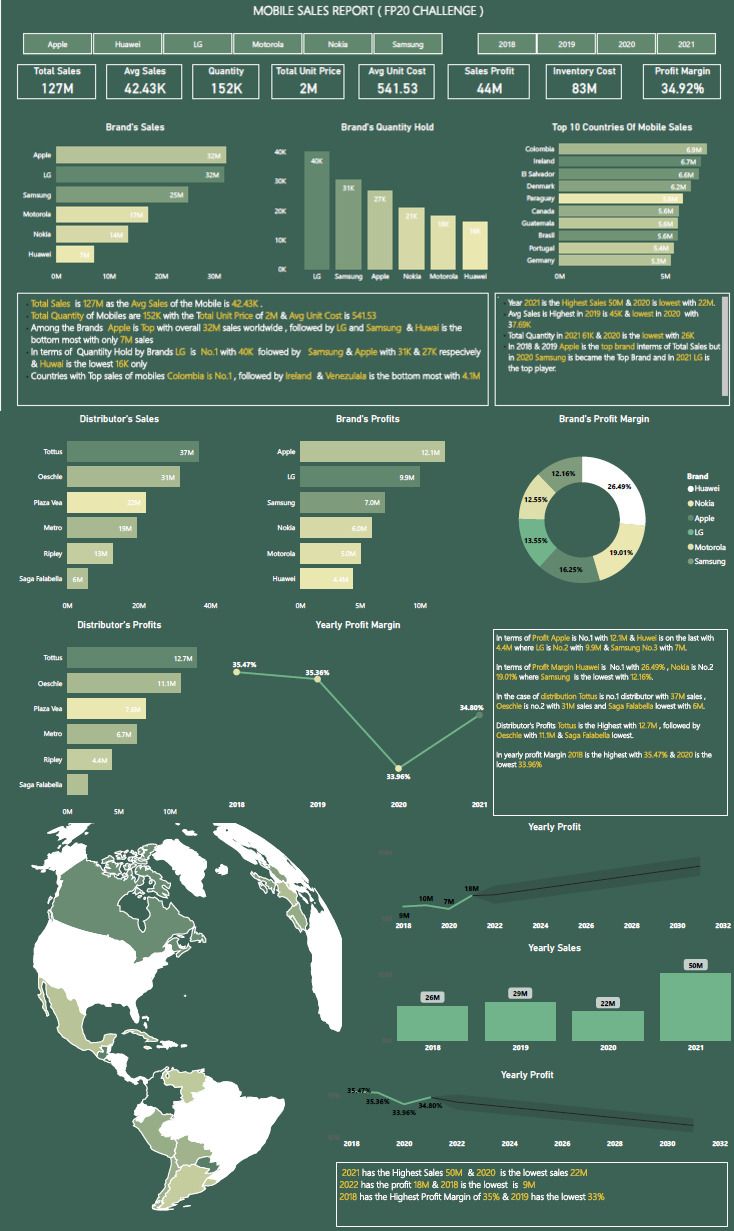
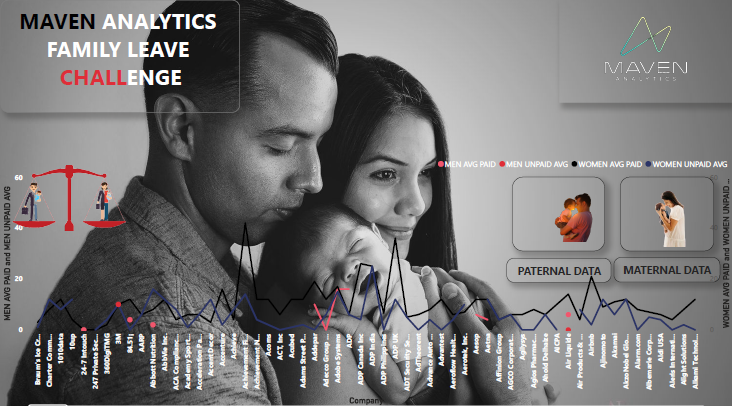
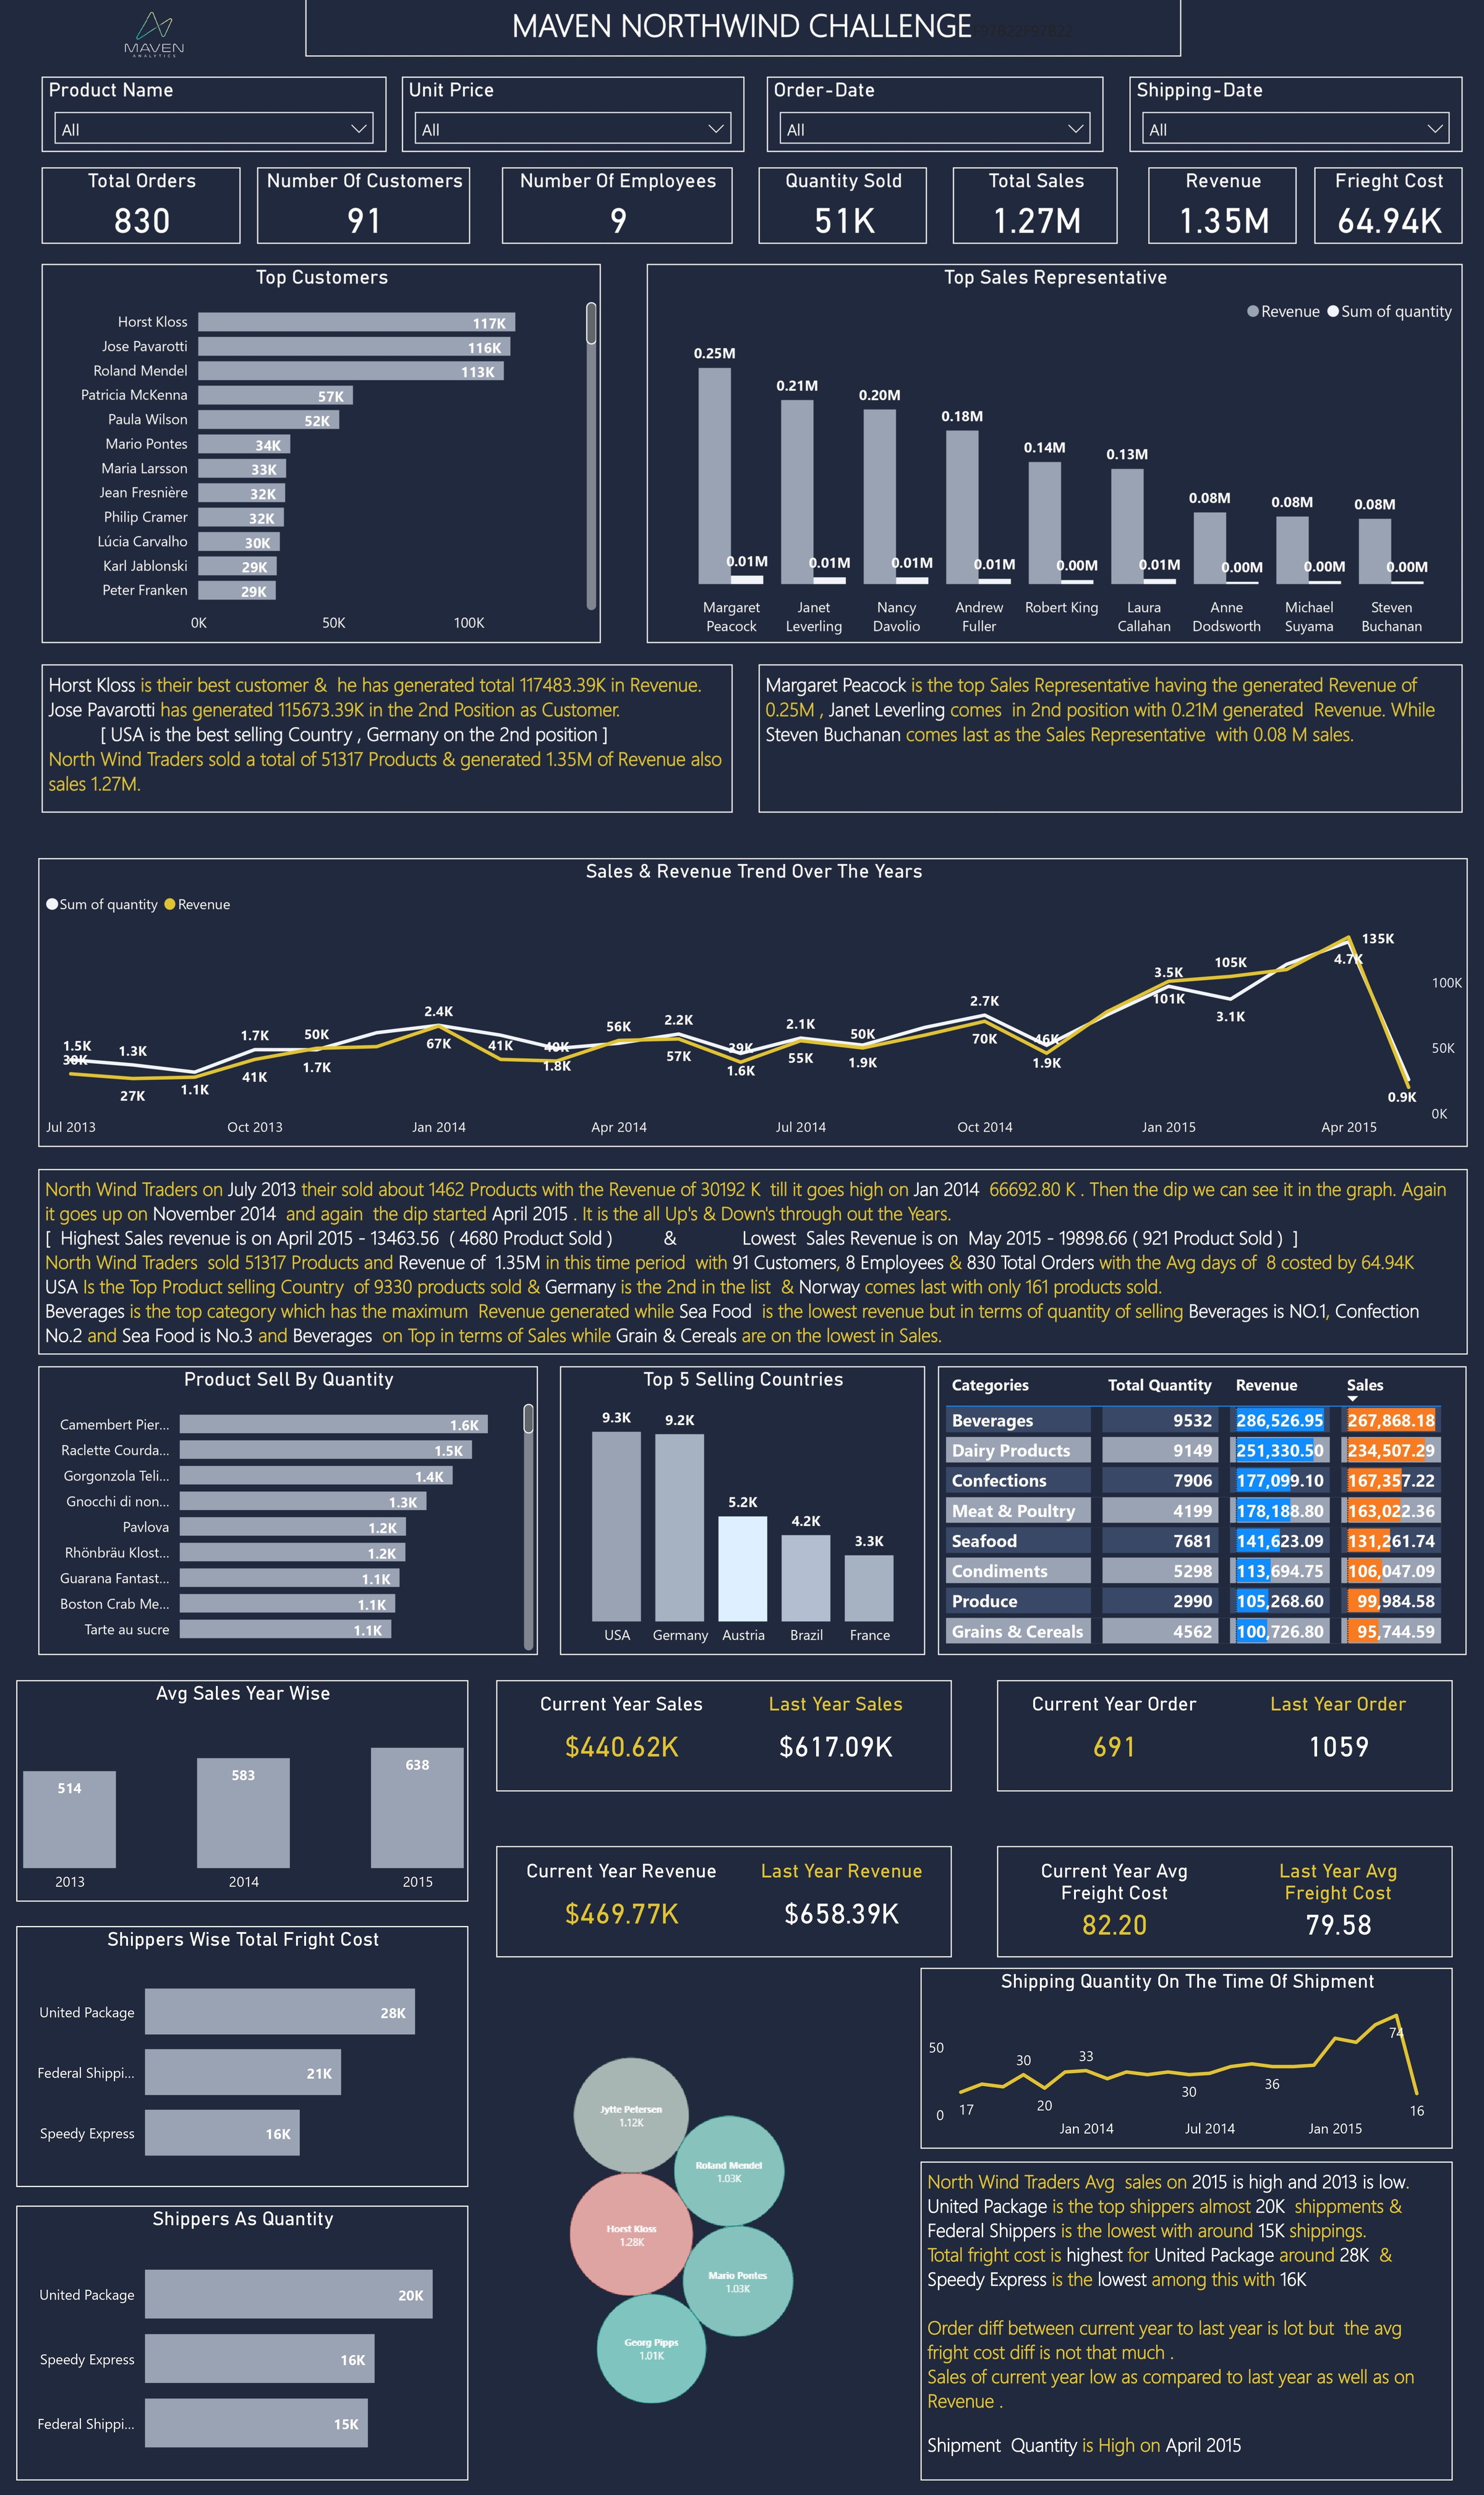
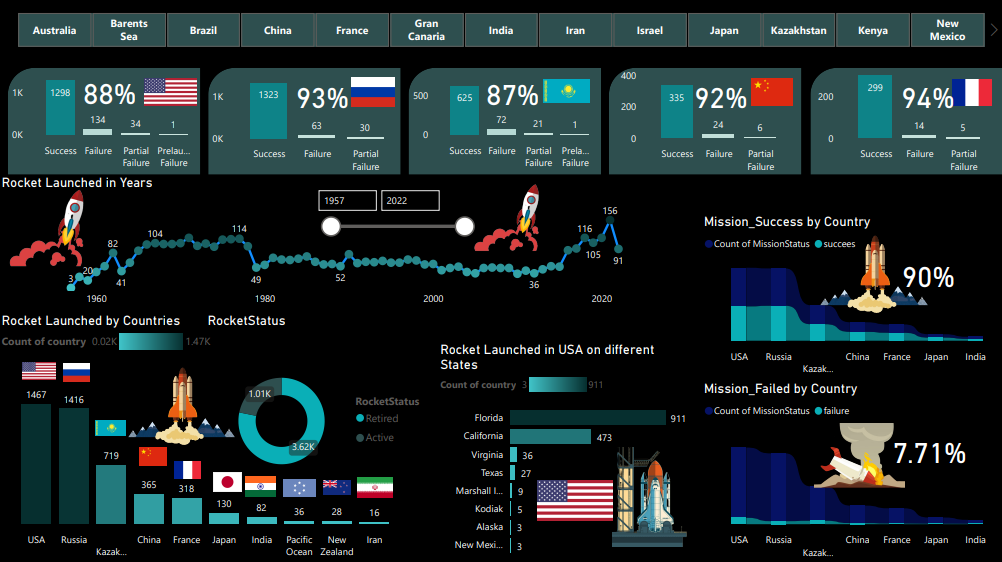
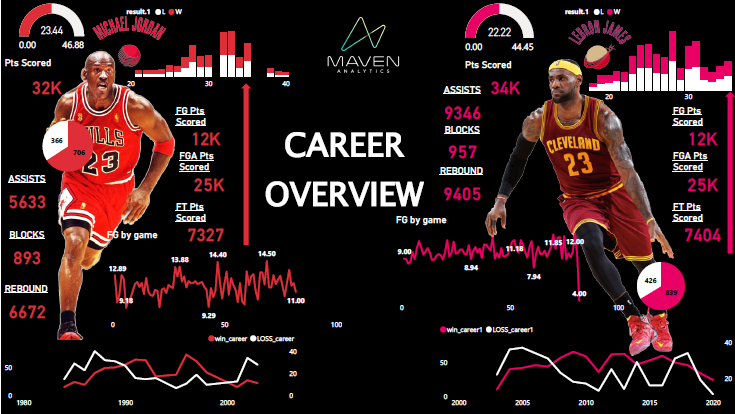
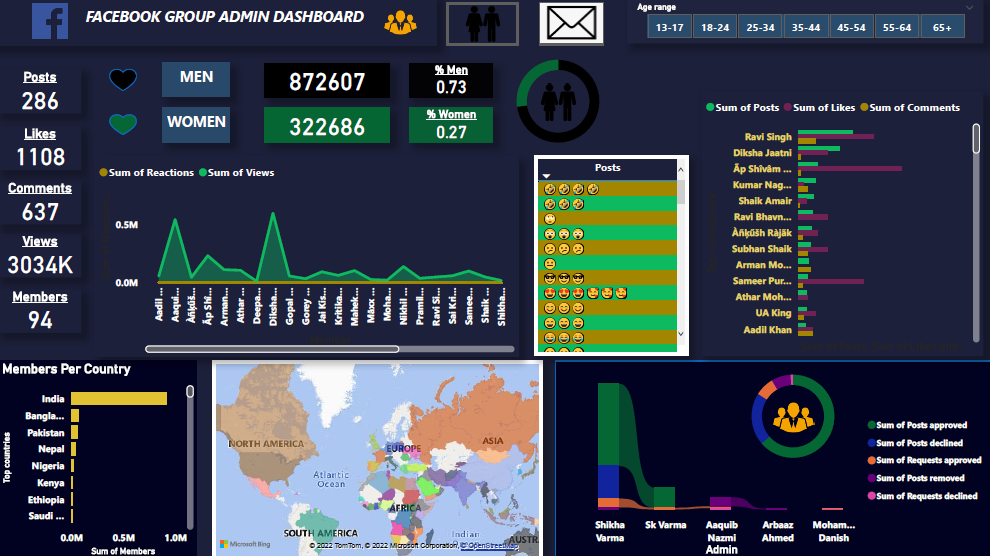
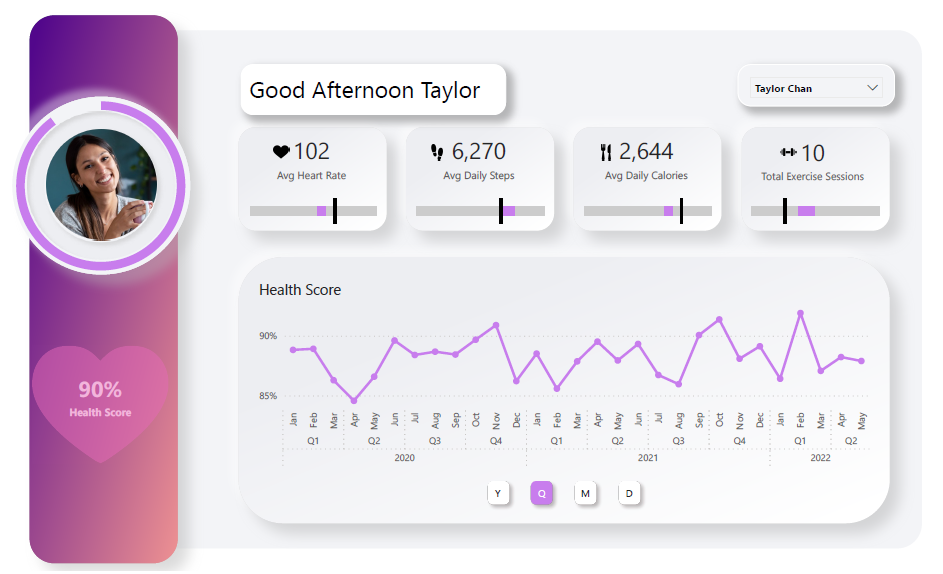
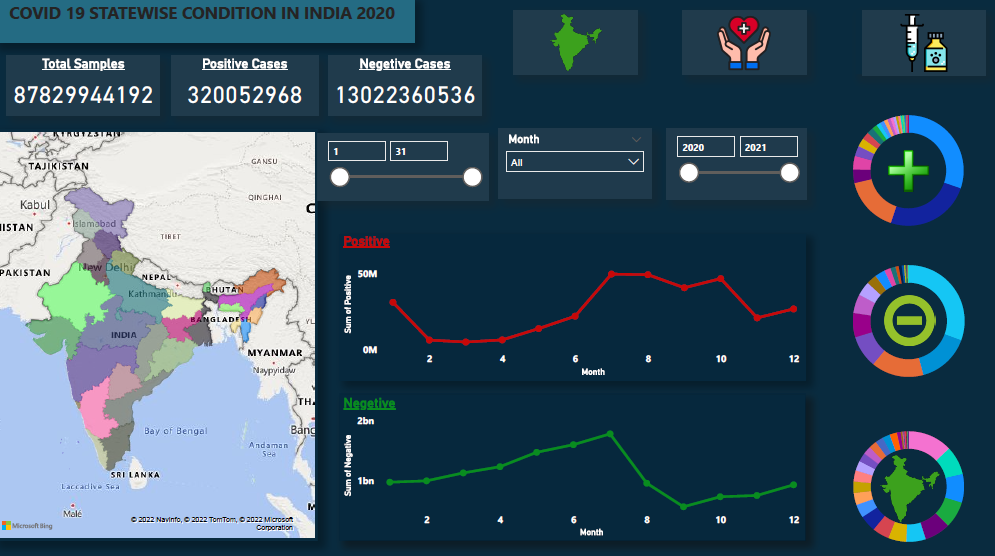
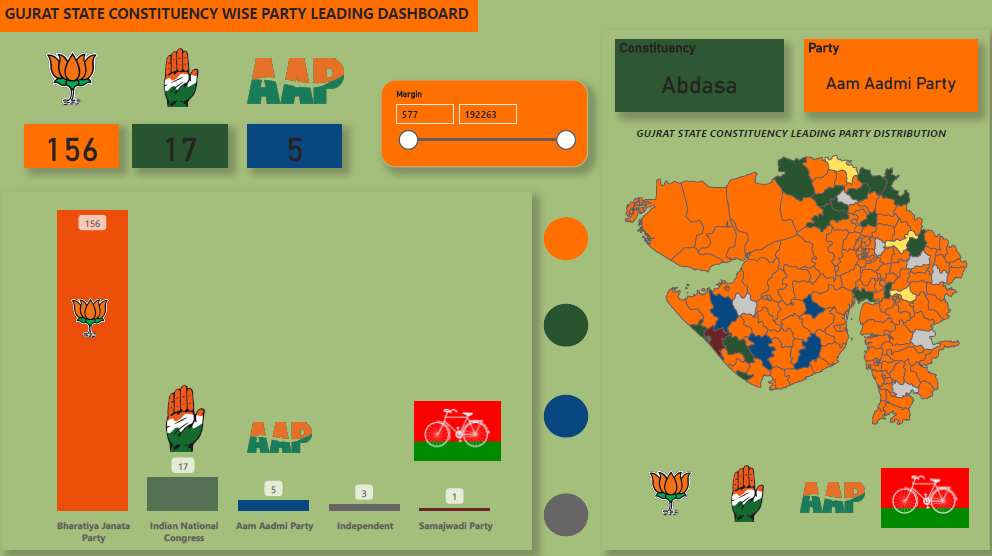
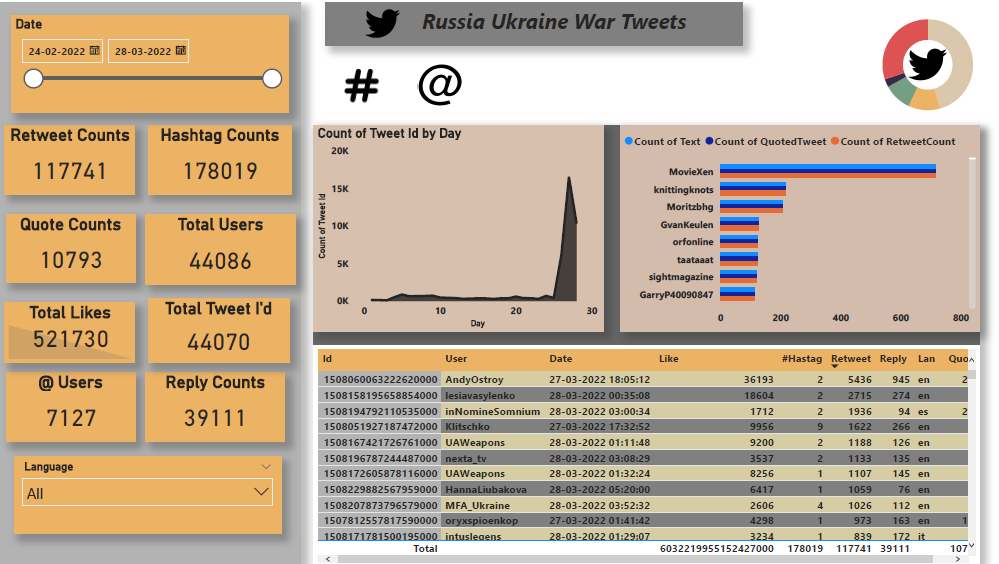
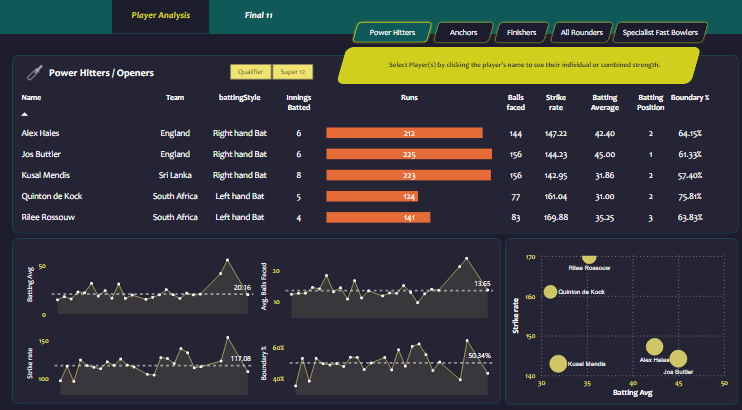
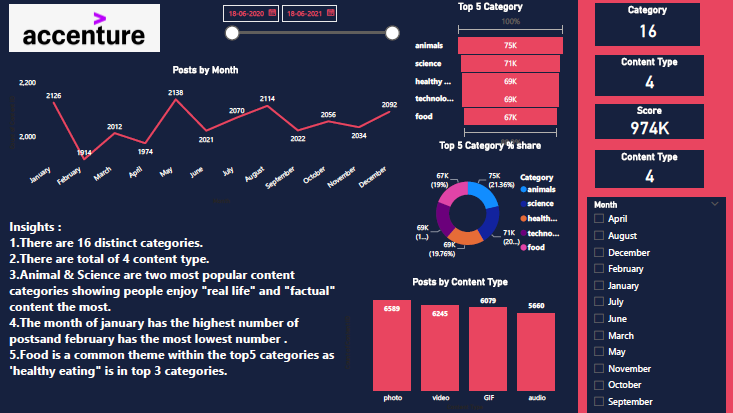
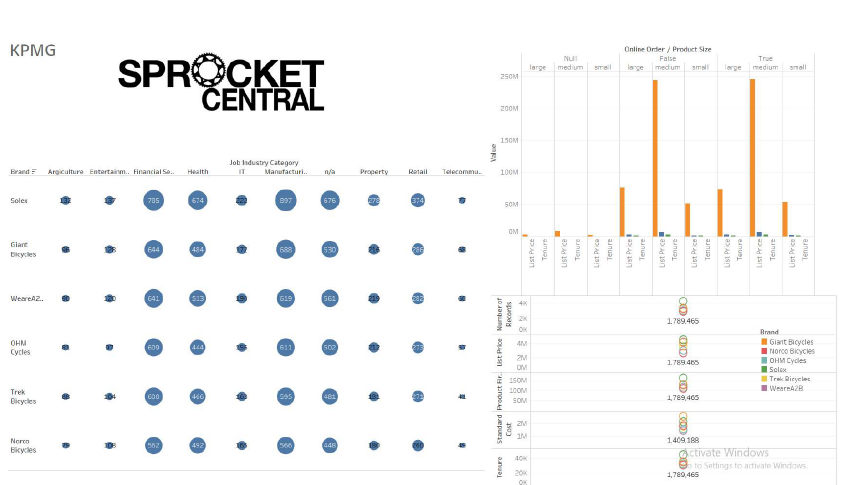
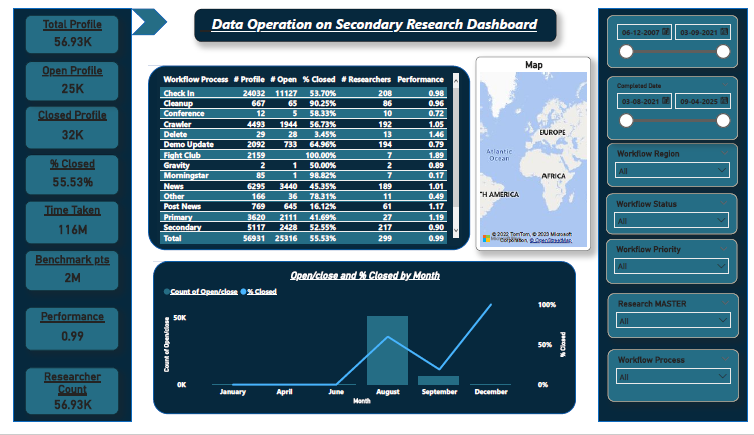
Using PowerBI and Tableau make a beautiful data visulization Dashoboard to understand data better and simpler manner.
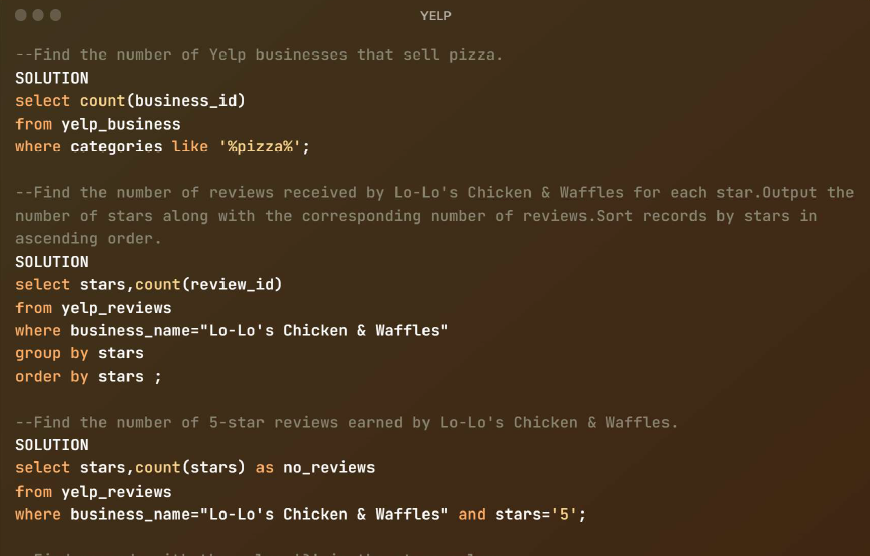
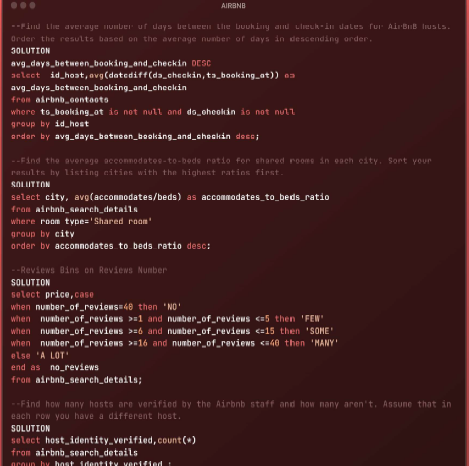
Using MySQL the Data can be analysis for various undestanding points by going deep inside the dataset.
The practice of working with data to glean useful information, which can then be used to make informed decisions
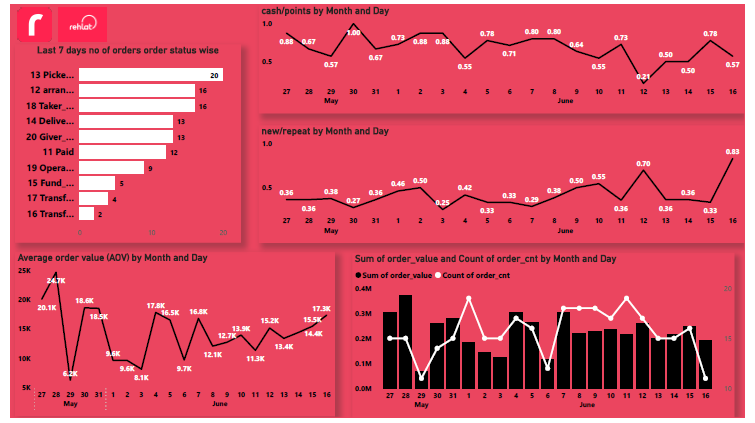
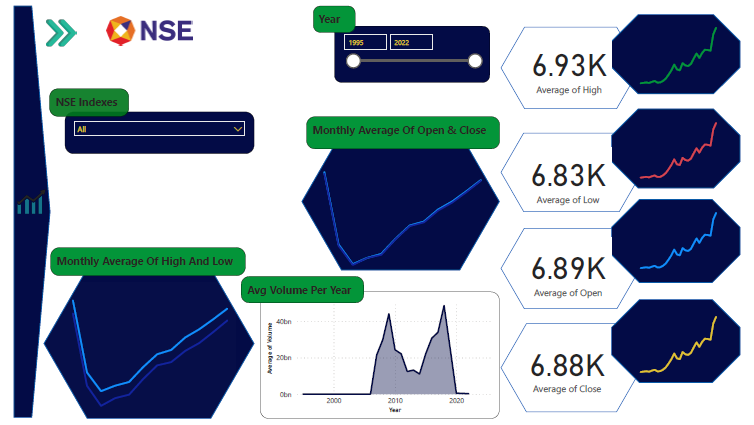
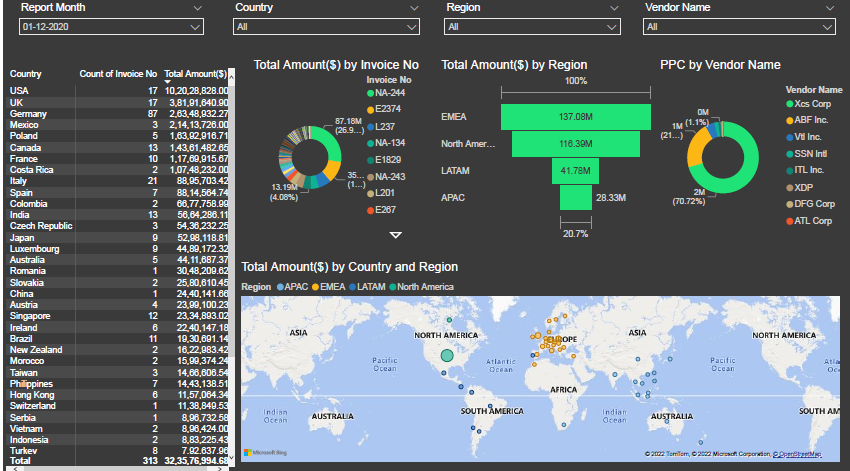
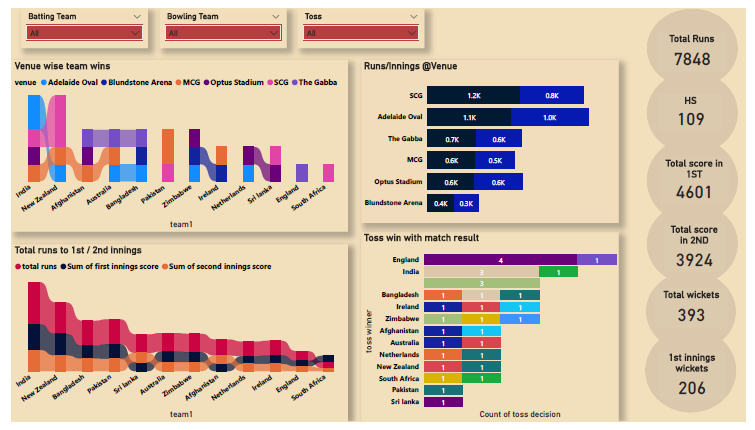
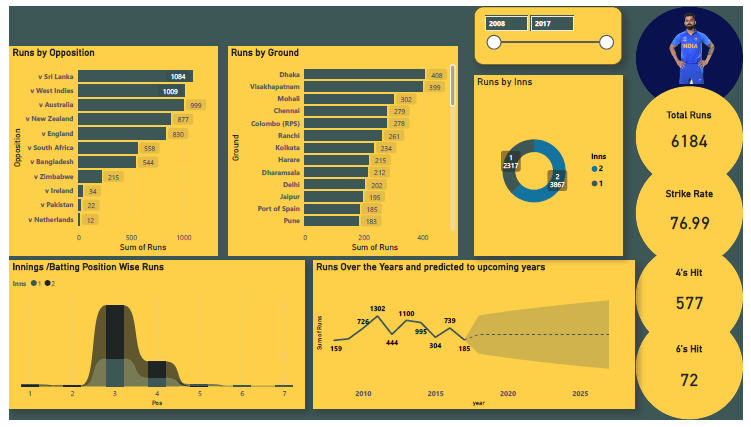

1. Production Efficiency Optimization
Tools Used : Power BI, SQL, Microsoft SQL Server, Excel
The project is about optimizing production efficiency. I collected and integrated data from various sources using SQL, including production logs and equipment sensor data.
I used Power BI to create interactive dashboards that provided real-time insights into production line performance, downtime analysis, and equipment utilization. SQL & Excel was used for additional data processing and ad-hoc analysis.
By identifying bottlenecks and inefficiencies, we were able to increase production throughput by 15% within three months.
2. Inventory Management and Forecasting
Tools Used: Power BI, SQL,Microsoft SQL Server, Excel
SQL was used to extract and transform historical sales and inventory data. Power BI was employed to visualize inventory trends, stock-outs, and demand patterns.
This project helped the client reduce excess inventory carrying costs by 20% while maintaining customer service levels.
3. Supply Chain Optimization
Tools Used: Power BI, SQL,Microsoft SQL Server, Azure
Used advanced SQL to combine data from Azure Cloud, perform calculations including suppliers' performance data and transportation logs.
Power BI was used to create supply chain dashboards that tracked supplier lead times, transportation costs, and inventory turnover & perform cost-benefit analyses for different supplier and logistics scenarios.
As a final output, the client achieved a 15% reduction in transportation costs and a 10% improvement in on-time delivery performance.
For Data Analyst job, freelancing, Dashboard Building , Dashboard Design